Contact Us
Water And Sewage Global Market Opportunities And Strategies To 2034

Water And Sewage Market 2025 – By Type (Water Supply And Irrigation Systems, Sewage Treatment Facilities, Steam And Air Conditioning Supply), By Operator (Public, Private), By End-User (Residential, Commercial, Industrial, Agriculture), And By Region, Opportunities And Strategies – Global Forecast To 2035

Water And Sewage Global Market Opportunities And Strategies To 2034

Report Price : $4490.00 | Pages : 577 | Published : May 2025 | Delivery Time: Immediately Info icon | Format : pdf icon

Water And Sewage Market Definition

Water and sewage market refers to the industry responsible for the collection, treatment, distribution, and disposal of water and wastewater. This market includes the infrastructure, services, and technologies used to manage fresh water supply, sewage treatment, and wastewater management for residential, commercial, industrial, and municipal use. The primary purpose includes collecting and treating sewage and wastewater to remove contaminants before safely discharging it back into the environment or reusing it.

The water and sewage market consists of sales of water and sewage treatment services by entities (organizations, sole traders and partnerships) that operate water treatment plants and water supply and sewer systems. Water and sewage services provide treatment facilities that helps to treat water and sewage.

Water And Sewage Market Size and growth rate 2025 to 2029: Graph

Water And Sewage Market Size

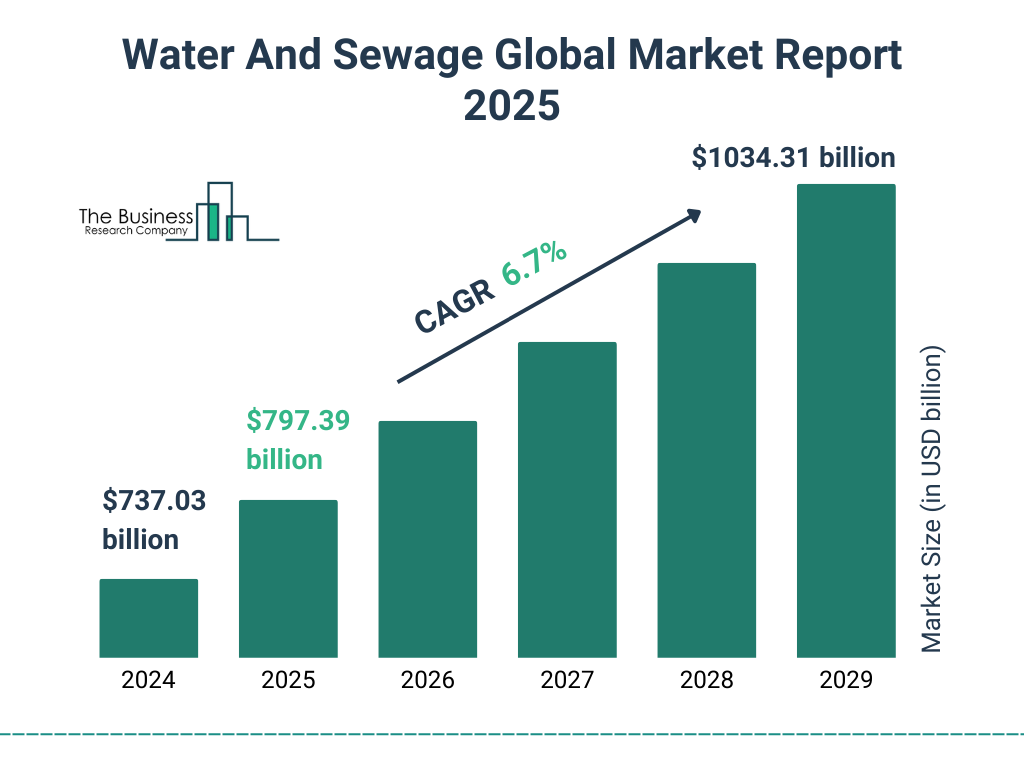
The global water and sewage market reached a value of nearly $7,14,564.70 million in 2024, having grown at a compound annual growth rate (CAGR) of 5.96% since 2019. The market is expected to grow from $7,14,564.70 million in 2024 to $9,92,363.05 million in 2029 at a rate of 6.79%. The market is then expected to grow at a CAGR of 6.41% from 2029 and reach $1,354,099.25 million in 2034.

Growth in the historic period resulted from increasing environmental concerns, large amount of untreated wastewater and favorable government initiatives. Factors that negatively affected growth in the historic period were aging infrastructure and land acquisition issues.

Going forward, growing industrialization, rising water scarcity and conservation efforts, rise in smart city initiatives and rising investments in water infrastructure will drive the growth. Factor that could hinder the growth of the water and sewage market in the future include funding gaps and stringent regulations.  

Water And Sewage Market Drivers

The key drivers of the water and sewage market include:

Growing Industrialization

The growing industrialization is expected to propel the growth of the water and sewage market, during the forecast period. The expansion of industries increases demand for water supply infrastructure and wastewater treatment facilities due to the high-water consumption required for manufacturing, cooling and processing. Additionally, industrial activities generate substantial wastewater containing chemicals, heavy metals and organic pollutants. Strict environmental regulations mandate proper treatment of these effluents, driving growth in the sewage treatment sector. For example, in August 2024, according to the National Bureau of Statistics of China, a China-based government agency, industrial production in China increased 5.10% in July 2024, over the same month in the previous year. Additionally, industrial production in India increased 5.90% in May 2024, over the same month in the previous year. Therefore, the growing industrialization will drive the growth of the water and sewage market.

Water And Sewage Market Restraints

The key restraints on the water and sewage market include:

Funding Gaps

During the forecast period, the funding gaps are expected to hinder the growth of the water and sewage market. Many water and sewage systems are outdated and in urgent need of repair or upgrades. Insufficient funding leads to increased leaks, pipe bursts and sewage overflows, causing inefficiencies and potential health risks. Additionally, rapid urbanization drives higher demand for these services, yet financial constraints hinder infrastructure expansion, particularly in rural and low-income areas. This lack of investment exacerbates disparities in access to clean water and proper sanitation. For example, in June 2024, according to United Nations Water, a Switzerland-based interagency mechanism that coordinates the efforts of United Nations entities and international organizations working on water and sanitation, developing countries allocate approximately 0.5% of their GDP to water infrastructure annually, creating a significant funding gap. This shortfall hinders efforts to upgrade aging systems and expand essential services. Therefore, the funding gaps will restrain the growth of the water and sewage market.

Water And Sewage Market Trends

Major trends shaping the water and sewage market include:

Transforming Aging Water Infrastructure For Enhanced Efficiency

Leading companies operating in the water and sewage market are focusing on transforming the aging water infrastructure by investing in advanced technologies. This transformation aims to enhance efficiency, reduce water loss and ensure reliable service delivery while meeting regulatory standards. For instance, in February 2025, Vortex Companies, a US-based provider of trenchless infrastructure solutions, launched Vortex Water, a new division dedicated to transforming aging water infrastructure. The goal is to offer sustainable, high-performance solutions to municipalities dealing with critical water infrastructure issues. This initiative broadens Vortex's expertise beyond sewer and industrial rehabilitation to include the restoration of aging water systems. By utilizing advanced materials, trenchless technologies and innovative solutions, it aims to address the deterioration of water pipelines and infrastructure, which can lead to frequent failures like water main breaks—occurring approximately every two minutes in the U.S..

Advanced Filtration Technologies In Wastewater Management

Major companies operating in the water and sewage market are focusing on developing innovative wastewater systems that integrate advanced treatment technologies, such as membrane filtration and biological nutrient removal. These innovations aim to enhance water quality, reduce environmental impact and increase the efficiency of wastewater management. For instance, in May 2024, Synagro Technologies, Inc., a US-based company that provides water and sewage services, launched the SynaPure Water and Wastewater Treatment System. This innovative technology offers sustainable and cost-effective solutions for treating complex influent streams, including landfill leachate, industrial wastewater and lagoon wastewater. The SynaPure system is engineered to eliminate a broad spectrum of contaminants, such as chemical oxygen demand (COD), suspended and dissolved solids, nutrients, metals, per- and polyfluoroalkyl substances (PFAS) and emerging pollutants, achieving efficiency rates of up to 98% in contaminant removal. This launch supports Synagro's sustainable growth strategy, boosting its ability to deliver clean water solutions to industrial users and wastewater facilities throughout North America.

Opportunities And Recommendations In The Water And Sewage Market

Opportunities – The top opportunities in the water and sewage markets segmented by type will arise in the water supply and irrigation systems segment, which will gain $1,33,024.34 millions of global annual sales by 2029. The top opportunities in the water and sewage markets segmented by operator will arise in the public segment, which will gain $1,92,969.06 millions of global annual sales by 2029. The top opportunities in the water and sewage markets segmented by end user will arise in the industrial segment, which will gain $1,17,123.46 millions of global annual sales by 2029. The water and sewage market size will gain the most in the USA at $61,750.62 million.

Recommendations- To take advantage of the opportunities, The Business Research Company recommends the water and sewage companies to focus on upgrading aging infrastructure with advanced technologies, focus on advanced treatment systems to improve efficiency and environmental compliance, focus on optimizing plant efficiency through digital solutions, focus on innovative industrial water treatment solutions, expand in emerging markets, continue to focus on developed markets, focus on expanding reach through strategic partnerships in underserved regions, focus on adopting tiered pricing to balance cost recovery and affordability, focus on building trust through transparency and education, focus on digital channels to improve customer outreach and feedback and focus on targeting industrial end-users through specialized personnel and technical expertise.

Water And Sewage Market Segmentation

The water and sewage market is segmented by type, by operator and by end user.


By Type –


The water and sewage market is segmented by type into:

    • a) Water Supply And Irrigation Systems
    • b) Sewage Treatment Facilities
    • c) Steam And Air Conditioning Supply
    • d) Other Types

The water supply and irrigation systems market was the largest segment of the water and sewage market segmented by type, accounting for 50.97% or $3,64,200.05 million of the total in 2024. Going forward, the sewage treatment facilities segment is expected to be the fastest growing segment in the water and sewage market segmented by type, at a CAGR of 7.81% during 2024-2029.


By Operator –


The water and sewage market is segmented by operator into:

    • a) Public
    • b) Private
    • b) Other Operators

The public market was the largest segment of the water and sewage market segmented by operator, accounting for 70.78% or $5,05,776.05 million of the total in 2024. Going forward, the private segment is expected to be the fastest growing segment in the water and sewage market segmented by operator, at a CAGR of 7.06% during 2024-2029.


By Banking Mode –


The water and sewage market is segmented by banking mode into:

    • a) Residential
    • b) Commercial
    • c) Industrial
    • d) Agriculture
    • e) Other End User

The industrial market was the largest segment of the water and sewage market segmented by end user, accounting for 35.83% or $2,56,026.31 million of the total in 2024. Going forward, the industrial segment is expected to be the fastest growing segment in the water and sewage market segmented by end user, at a CAGR of 7.83% during 2024-2029.


By Geography - The water and sewage market is segmented by geography into:

      o Asia Pacific

      • • China
      • • India
      • • Japan
      • • Australia
      • • Indonesia
      • • South Korea
      • • Bangladesh
      • • Thailand
      • • Vietnam
      • • Malaysia
      • • Singapore
      • • Philippines
      • • Hong Kong
      • • New Zealand

      o North America

      • • USA
      • • Canada
      • • Mexico

      o South America

      • • Brazil
      • • Chile
      • • Argentina
      • • Colombia
      • • Peru

      o Western Europe

      • • France
      • • Germany
      • • UK
      • • Italy
      • • Spain
      • • Austria
      • • Belgium
      • • Denmark
      • • Finland
      • • Ireland
      • • Netherlands
      • • Norway
      • • Portugal
      • • Sweden
      • • Switzerland

      o Eastern Europe

      • • Russia
      • • Czech Republic
      • • Poland
      • • Romania
      • • Ukraine

      o Middle East

    • • Saudi Arabia
    • • Israel
    • • Iran
    • • Turkey
    • • UAE
    • o Africa

    • • Egypt
    • • Nigeria
    • • South Africa

North America was the largest region in the water and sewage market, accounting for 33.39% or $2,38,576.44 million of the total in 2024. It was followed by Asia Pacific, Western Europe and then the other regions. Going forward, the fastest-growing regions in the water and sewage market will be Africa and South America where growth will be at CAGRs of 9.60% and 9.54% respectively. These will be followed by Middle East and Asia Pacific where the markets are expected to grow at CAGRs of 9.52% and 8.34% respectively.

Water And Sewage Market Competitive Landscape

Major Competitors are:

  • Veolia Environment SA
  • Companhia de Saneamento Basico-Sabesp
  • American Water Works Company Inc.
  • Water Corporation
  • Thames Water Utilities Limited
  • Other Competitors Include:

  • Xylem Inc.
  • Severn Trent plc
  • United Utilities Group plc
  • Engie SA
  • Huaneng Power International Inc.
  • Evoqua Water Technologies
  • SUEZ Group
  • Clean TeQ Water Limited
  • Sauber Environmental Solutions Pvt Ltd
  • Adroit Associates Private Limited
  • SWA Water Australia
  • WOG Group
  • Thermax Limited
  • Kurita Water Industries Ltd
  • Aquatech Systems (Asia) Pvt. Ltd
  • Toshiba Water Solution & Services Pvt. Ltd
  • Hindustan Dorr-Oliver Ltd
  • Doosan Corporation
  • VA Tech Wabag Ltd
  • Allpipe Technologies
  • Fluidchem Valves (I) Pvt Ltd
  • Samyang Corporation
  • Samsung Electronics Co., Ltd
  • Hung Hua Construction
  • CTCI Group
  • FujiClean CO., LTD.
  • Henan Zhong An Electronic Detection Technology CO., LTD
  • iangsu Jiuwu Hi-Tech Co. Ltd
  • Xi an QingYun Water Treatment Tech Co. Ltd
  • Shanghai Dazhang Filtration Equipment Co., Ltd
  • Mitsubishi Heavy Industries, Ltd
  • Korea Water Resources Corporation (K-water)
  • Kolon Water & Energy Co., Ltd
  • Hanyang Corporation
  • Pentair plc
  • Kemira Global
  • Mott MacDonald
  • Remondis Group
  • Feralco Group
  • Hydrite Chemical Co
  • Italmatch Chemicals S.p.A.
  • Skanska AB
  • The York Water Company
  • Lenntech B.V.
  • Evonik Industries AG
  • Salinity Solutions Limited
  • Alfa Laval AB
  • Ekopak
  • Westlake Vinnolit GmbH & Co. KG
  • Kurita Europe GmbH
  • SNF Floerger
  • Lanxess AG
  • ABB Group
  • Membion GmbH
  • ACA Pescara
  • De Watergroep
  • European Water Association (EWA)
  • European Association of Public Water Operators
  • Croatian Water and Waste Water Association (GVIK)
  • Water Supply and Sewerage Association of the Czech Republic (SOVAK)
  • Hungarian Water Utility Association (MaViz)
  • Romanian Water Association (ARA)
  • Nexus Water Group
  • Neptune Water Solutions
  • Corix Infrastructure Services (US) Inc
  • Prince Rupert
  • Veolia North America
  • American Water Works Company, Inc
  • Aqua America, Inc
  • AquaTec
  • AECOM Canada
  • Stantec Inc
  • SUEZ Water Technologies & Solutions
  • Fluence Corporation
  • Ecolab
  • Aegea Sanitation
  • Sabesp (Basic Sanitation Company of the State of São Paulo)
  • BRK Environmental
  • Iguá Sanitation
  • Aguas Andinas (Andean Waters)
  • Essbio (Bio Waters)
  • AES Arabia Ltd.
  • Emvees Wastewater Treatment LLC
  • Metito
  • Abu Dhabi National Energy Company (TAQA)
  • PASSAVANT Energy & Environment GmbH
  • Ivanhoe Mines
  • WEC Projects
  • Lektratek Water Technology
  • Maskam Water
  • PCI Africa (formerly Paterson Candy International)
  • Aquamat SA Pty Ltd
  • Water Icon
  • Author: Abdul Wasay

    Water and Sewage Market Size

    The global water and sewage market size reached a value of nearly $578.4 billion in 2021, having increased at a compound annual growth rate (CAGR) of 3.4% since 2016. The global water and sewage market size is expected to grow from 578.41 billion in 2021 to $852.92 billion in 2026 at a rate of 7.1%. The global water and sewage market size is then expected to grow at a CAGR of 8.3% from 2026 and reach $1,271.20 billion in 2031.    

    Growth in the historic period resulted from an increase in regulations of government for wastewater treatment, rapid urbanization, growing wastewater complexities, increased demand for water from agricultural sector, increased demand for steam and air-conditioning supply, and emerging markets growth.

    Going forward, the rise in global population, rapidly diminishing freshwater resources, increasing demand for wastewater treatment, industrial pollutions, awareness on cleanliness and increasing smart cities will drive growth. Factors that could hinder the growth of the water and sewage market in the future include high cost of water treatment technology.

    Water and Sewage Market Drivers

    The key drivers of the water and sewage market include:

    Rapidly Diminishing Fresh Water Resources

    The rapid diminishing of freshwater resources will drive the water and sewage market. The total amount of water on the planet is estimated to be 1 400 million cubic kilometres. However, only 0.003% of this large volume, or around 45 000 cubic kilometres, are "fresh water resources" that might be used for drinking, sanitation, agriculture, and industry. However, not all of this water is accessible since during seasonal floods, some of it runs into isolated rivers.  And, as both population and temperature continue to rise, the freshwater is under serious strain. Water is difficult to transport over long distances, and human requirements, both for food and industry, are increasing. According to a Nasa-led study, many of the world’s freshwater sources are being drained faster than they are being replenished. Of the world’s major aquifers (gravel and sand-filled underground reservoirs), 21 out of 37 are receding, from India and China to the United States and France. The Ganges Basin in India is depleting, due to population and irrigation demands, by an estimated 6.31 centimeters every year.  Hence, the rapid diminishing of freshwater will propel the growth of the water and sewage market.

    Water and Sewage Market Restraints

    The key restraints on the water and sewage market include:

    High Cost Of Water Treatment Technology

    The high cost of water treatment technology will restrain the growth of the water and sewage market. Primary, secondary, and tertiary treatment are the three stages of wastewater treatment. Wastewater treatment necessitates specialized knowledge and abilities. These procedures necessitate a significant amount of capital. The Development Bank of Latin America (CAF), for example, estimates that USD 80 billion will be spent on sewage infrastructure and USD 33 billion on wastewater treatment between 2010 and 2030.  Flow rates of effluent, water quality, the required degree of purity, and building materials are all factors that raise the cost of wastewater treatment. The chemical composition and content of the effluent stream to be treated is a crucial element in the cost of most wastewater treatment systems. It's critical to fully comprehend the types and amounts of compounds present, as well as any variations in the effluent stream's composition. In general, the higher the number of contaminants present, the more steps in the water treatment process are necessary, and the higher the initial cost. Thus, the high cost of wastewater treatment will negatively impact the market growth market growth.

    Water and Sewage Market Trends

    Major trends influencing the water and sewage market include:

    Advanced Technologies To Treat Micro Pollutants

    Conventional wastewater treatment plants are using advanced technologies to treat micro pollutants. Micro-pollutants are contaminants originating from pharmaceutical residues, household chemicals, personal care products and pesticides. Technologies such as moving bed biofilm reactors (MBBR), ozone-based advanced oxidation, adsorption and powdered activated carbon (PAC) are being used to remove micro-pollutants from wastewater. There has been a growing focus on removing micro-pollutants from wastewater streams in European countries such as Germany and Switzerland. In Germany, advanced technologies such as GE’s membrane bioreactor and powdered activated carbon technology are proving to be a cost-effective way of removing micro-pollutants from wastewater. For instance, some of the major companies using advanced technologies to treat micro-pollutants include Suez Group, Arvia, and Novartis.

    Drip Irrigation Systems

    Drip irrigation system is an efficient technique to deliver water directly to the roots of the crop and reduce the wastage of water. Drip irrigation is a method of water irrigation in which water passes through a filter and into customized drip pipes with spaced emitters. A particular slow-release system distributes water straight into the soil near the roots through the emitters. Drip irrigation can help achieve water conservation by lowering evaporation and deep drainage if it is correctly designed, installed, and managed. Only the immediate root zone of each plant is wetted, as opposed to other methods of irrigation (sprinkler irrigation or surface irrigation). As a result, this can be a very effective irrigation method. For food or plant producing fields, drip irrigation can be a very technological irrigation technique. However, it is a low-tech approach when compared to more technical methods (such as spray irrigation). It is also feasible to use the treated water as irrigation water by combining this system with a water treatment plant (e.g., non-planted filter or artificial)

    Opportunities And Recommendations In The Water and Sewage Market

    Opportunities –The top opportunities in the water and sewage market segmented by type will arise in the Water Supply and Irrigation Systems segment, which will gain $143.1 billion of global annual sales by 2026. The top opportunities in segment by end-user will arise in the residential segment, which will gain $88.6 billion of global annual sales by 2026. The top opportunities in segment by public operator will arise in the type of operator segment, which will gain $229.4 billion of global annual sales by 2026. The water and sewage market size will gain the most in the USA at $51.5 billion.

    Recommendations –To take advantage of the opportunities, The Business Research Company recommends the water and sewage companies to focus on adopting advanced technologies to treat micro-pollutants, focus on using artificial intelligence, focus on adopting energy efficient technologies, expand in emerging markets, expand in countries offering incentives, scale up through partnerships and acquisitions, provide competitively priced offerings in low-income countries, offer value-based pricing, focus on direct marketing, leverage social media use to maximize reach and focus on urban population.

    Water and Sewage Market Segmentation

    The water and sewage market is segmented by type, by end-users and by operator.
    By Type -
    The water and sewage market is segmented by type into:
      • a) Water Supply and Irrigation Systems
      • b) Sewage Treatment Facilities
      • c) Steam and Air-Conditioning Supply
    The water supply and irrigation systems market was the largest segment of the water and sewage market segmented by type, accounting for 51.1% of the total in 2021. Going forward, both water supply and irrigation systems and sewage treatment facilities market is expected to be the fastest growing segment in the water and sewage market segmented by technology, at a CAGR of 7.4% during 2021-2026.
    By End-Users -
    The water and sewage market is segmented by end-users into:
      • a) Residential
      • b) Commercial
      • c) Industrial
      • d) Agriculture
    The residential market was the largest segment of the water and sewage market segmented by end-user, accounting for 29.6% of the total in 2021. Going forward, the residential segment is expected to be the fastest growing segment in the water and sewage market segmented by end-user, at a CAGR of 7.7% during 2021-2026.
    By Operator -
    The water and sewage market is segmented by operator into:
      • a) Public
      • b) Private
    The public operator market was the largest segment of the water and sewage market segmented by end-user channel, accounting for 91.7% of the total in 2021. Going forward, the private operator segment is expected to be the fastest growing segment in the water and sewage market segmented by end-user, at a CAGR of 12.2% during 2021-2026.
    By Geography- The water and sewage market is segmented by geography into:
      • o Asia Pacific
        • •  China
        • •  India
        • •  Japan
        • •  Australia
        • •  Indonesia
        • •  South Korea
        • •  Hong Kong
        • •  Malaysia
        • •  New Zealand
        • •  Philippines
        • •  Singapore
        • •  Thailand
        • •  Vietnam
      • o North America
        • • USA
        • •  Canada
        • •  Mexico
        o South America
        • •  Brazil
        • •  Argentina
        • •  Chile
        • •  Colombia
        • •  Peru
        • •  Venezuela
        o Western Europe
        • •  UK
        • •  Germany
        • •  France
        • •  Austria
        • •  Belgium
        • •  Denmark
        • •  Finland
        • •  Ireland
        • •  Italy
        • •  Netherlands
        • •  Norway
        • •  Portugal
        • •  Spain
        • •  Sweden
        • •  Switzerland
        o Eastern Europe
        • •  Russia
        • •  Czech Republic
        • •  Poland
        • •  Romania
        o Middle East
        • •  Saudi Arabia
        • •  Israel
        • •  Turkey
        • •  UAE
        o Africa
        • •  Egypt
        • •  Nigeria
        • •  South Africa
    Asia Pacific was the largest region in the global water and sewage market, accounting for 33.3% of the total in 2021. It was followed by North America, and then the other regions. Going forward, the fastest-growing regions in the global water and sewage market will be Middle East, and South America where growth will be at CAGRs of 9.8% and 9.2% respectively. These will be followed by Eastern Europe and Asia Pacific, where the markets are expected to grow at CAGRs of 8.1% and 7.0% respectively.

    Water and Sewage Market Competitive Landscape

    Major Competitors are:

  • Veolia Environment SA
  • Suez Environnement SA
  • Engie
  • Huaneng Power International, Inc
  • Companhia de Saneamento Basico-Sabesp
  • Other Competitors Include:

  • American Water Works Company, Inc.
  • United Utilities
  • Severn Trent Plc
  • Anglian Water
  • Ecolab Inc
  • Kurita Water Industries Ltd
  • Pt. Amrita Enviro Energi (Banten, Indonesia)
  • Aquatech International LLC (India)
  • Toplea Machinery Imp And. Exp Co., Ltd
  • Shanghai Kaiquan Pump (Group) Co., LTD
  • Water Corporation
  • Anbit Drilling Equipment Co., Ltd
  • Henan Zhong An Electronic Detection Technology CO., LTD
  • Jiangsu Jiuwu Hi-tech Co
  • Xi an QingYun Water Treatment Tech. Co., Ltd
  • GSD Industrial Co., Ltd
  • Shanghai Dazhang Filtrate Equipment Co.,Ltd
  • V? ???h W?b?g
  • ?h?rm?? ?nd??
  • Toshiba water solutions Pvt. Ltd
  • NALCO (National Aluminium Company Limited)
  • Thames Water
  • EUROWATER
  • Feralco Group
  • Berliner Wasserbetriebe
  • NCH Europe
  • Kemira
  • ClearFox
  • Lamor
  • Lifasa
  • Nuova Fima SpA
  • Elecnor
  • Dellmeco
  • OSMO Membrane Systems GmbH
  • Veolia Water Technologies
  • ASIO spol. s r.o
  • BWT Poland Sp. o.o
  • Orenco Systems (Oregon, The U.S.)
  • Danaher
  • Aquatech
  • Xylem Inc (U.S.)
  • Dow Water And Process Solutions (U.S.)
  • Calgon Carbon Corporation
  • Evoqua Water Technologies Corporation (U.S.)
  • 3M (U.S.)
  • Pentair Plc (U.S.)
  • ITT Inc. (U.S.)
  • DuPont (Delaware, United States)
  • GE Water And Process Technologies
  • UVDynamics Inc
  • JPS Industries
  • Les Traitements Bio-Bac Inc
  • Dynamix Agitators Inc
  • Ostara Nutrient Recovery Technologies Inc
  • Aqua One Filtration Inc
  • Membrane Specialists LLC
  • Ground Effects Environmental Services Inc
  • Atlantech - Model HR MACRO - Flotation System
  • Alexandria Water Company (AWCO)
  • Oman Water and Wastewater Services Company
  • Suido Kiko Middle East (SKME)
  • Proxa
  • WEC Projects
  • Lektratek Water Technology
  • Water Purification chemical Plant
  • Water Icon
  • List Of Tables

      Table 1: Global Water And Sewage Market, Historic, 2019 – 2024, $ Million
    • Table 2: Global Water And Sewage Market, Forecast, 2024 – 2029, 2034F , $ Million
    • Table 3: Global Water And Sewage Market TAM, 2024 And 2034, $ Million
    • Table 4: Global Water And Sewage Market, Segmentation By Type, Historic And Forecast, 2019 – 2024, 2029F, 2034F, $ Million
    • Table 5: Global Water And Sewage Market, Segmentation By Operator, Historic And Forecast, 2019 – 2024, 2029F, 2034F, $ Million
    • Table 6: Global Water And Sewage Market, Segmentation By End User, Historic And Forecast, 2019 – 2024, 2029F, 2034F, $ Million
    • Table 7: Global Water And Sewage Market, Sub-Segmentation Of Water Supply And Irrigation Systems, By Type, Historic And Forecast, 2019 – 2024, 2029F, 2034F, $ Million
    • Table 8: Global Water And Sewage Market, Sub-Segmentation Of Sewage Treatment Facilities, By Type, Historic And Forecast, 2019 – 2024, 2029F, 2034F, $ Million
    • Table 9: Global Water And Sewage Market, Sub-Segmentation Of Steam And Air Conditioning Supply, By Type, Historic And Forecast, 2019 – 2024, 2029F, 2034F, $ Million
    • Table 10: Global Water And Sewage Market, By Region, Historic and Forecast, 2019 – 2024, 2029F, 2034F, $ Million
    • Table 11: Global Water And Sewage Market, By Country, Historic and Forecast, 2019 – 2024, 2029F, 2034F, $ Million
    • Table 12: Asia-Pacific GDP Per Capita, By Country, 2019-2024, $
    • Table 13:  Asia-Pacific Population, By Country, 2019-2029, Millions
    • Table 14: Asia-Pacific Water And Sewage Market, Segmentation By Type, Historic And Forecast, 2019 – 2024, 2029F, 2034F, $ Million
    • Table 15: Asia-Pacific Water And Sewage Market, Segmentation By Operator, Historic And Forecast, 2019 – 2024, 2029F, 2034F, $ Million
    • Table 16: Asia-Pacific Water And Sewage Market, Segmentation By End User, Historic And Forecast, 2019 – 2024, 2029F, 2034F, $ Million
    • Table 17: China GDP Per Capita, 2019-2024, $
    • Table 18:  China Population, 2019-2029, Millions
    • Table 19: China Water And Sewage Market, Segmentation By Type, Historic And Forecast, 2019 – 2024, 2029F, 2034F, $ Million
    • Table 20: China Water And Sewage Market, Segmentation By Operator, Historic And Forecast, 2019 – 2024, 2029F, 2034F, $ Million
    • Table 21: China Water And Sewage Market, Segmentation By End User, Historic And Forecast, 2019 – 2024, 2029F, 2034F, $ Million
    • Table 22: India Water And Sewage Market, Segmentation By Type, Historic And Forecast, 2019 – 2024, 2029F, 2034F, $ Million
    • Table 23: India Water And Sewage Market, Segmentation By Operator, Historic And Forecast, 2019 – 2024, 2029F, 2034F, $ Million
    • Table 24: India Water And Sewage Market, Segmentation By End User, Historic And Forecast, 2019 – 2024, 2029F, 2034F, $ Million
    • Table 25: Japan GDP Per Capita, 2018-2023, $
    • Table 26:  Japan Population, By Country, 2019-2029, Millions
    • Table 27: Japan Water And Sewage Market, Segmentation By Type, Historic And Forecast, 2019 – 2024, 2029F, 2034F, $ Million
    • Table 28: Japan Water And Sewage Market, Segmentation By Operator, Historic And Forecast, 2019 – 2024, 2029F, 2034F, $ Million
    • Table 29: Japan Water And Sewage Market, Segmentation By End User, Historic And Forecast, 2019 – 2024, 2029F, 2034F, $ Million
    • Table 30: Australia Water And Sewage Market, Segmentation By Type, Historic And Forecast, 2019 – 2024, 2029F, 2034F, $ Million
    • Table 31: Australia Water And Sewage Market, Segmentation By Operator, Historic And Forecast, 2019 – 2024, 2029F, 2034F, $ Million
    • Table 32: Australia Water And Sewage Market, Segmentation By End User, Historic And Forecast, 2019 – 2024, 2029F, 2034F, $ Million
    • Table 33: Indonesia Water And Sewage Market, Segmentation By Type, Historic And Forecast, 2019 – 2024, 2029F, 2034F, $ Million
    • Table 34: Indonesia Water And Sewage Market, Segmentation By Operator, Historic And Forecast, 2019 – 2024, 2029F, 2034F, $ Million
    • Table 35: Indonesia Water And Sewage Market, Segmentation By End User, Historic And Forecast, 2019 – 2024, 2029F, 2034F, $ Million
    • Table 36: South Korea GDP Per Capita, 2018-2023, $
    • Table 37:  South Korea Population, 2018-2028, Millions
    • Table 38: South Korea Water And Sewage Market, Segmentation By Type, Historic And Forecast, 2019 – 2024, 2029F, 2034F, $ Million
    • Table 39: South Korea Water And Sewage Market, Segmentation By Operator, Historic And Forecast, 2019 – 2024, 2029F, 2034F, $ Million
    • Table 40: South Korea Water And Sewage Market, Segmentation By End User, Historic And Forecast, 2019 – 2024, 2029F, 2034F, $ Million
    • Table 41: Bangladesh Water And Sewage Market, Segmentation By Type, Historic And Forecast, 2019 – 2024, 2029F, 2034F, $ Million
    • Table 42: Bangladesh Water And Sewage Market, Segmentation By Operator, Historic And Forecast, 2019 – 2024, 2029F, 2034F, $ Million
    • Table 43: Bangladesh Water And Sewage Market, Segmentation By End User, Historic And Forecast, 2019 – 2024, 2029F, 2034F, $ Million
    • Table 44: Thailand Water And Sewage Market, Segmentation By Type, Historic And Forecast, 2019 – 2024, 2029F, 2034F, $ Million
    • Table 45: Thailand Water And Sewage Market, Segmentation By Operator, Historic And Forecast, 2019 – 2024, 2029F, 2034F, $ Million
    • Table 46: Thailand Water And Sewage Market, Segmentation By End User, Historic And Forecast, 2019 – 2024, 2029F, 2034F, $ Million
    • Table 47: Vietnam Water And Sewage Market, Segmentation By Type, Historic And Forecast, 2019 – 2024, 2029F, 2034F, $ Million
    • Table 48: Vietnam Water And Sewage Market, Segmentation By Operator, Historic And Forecast, 2019 – 2024, 2029F, 2034F, $ Million
    • Table 49: Vietnam Water And Sewage Market, Segmentation By End User, Historic And Forecast, 2019 – 2024, 2029F, 2034F, $ Million
    • Table 50: Malaysia Water And Sewage Market, Segmentation By Type, Historic And Forecast, 2019 – 2024, 2029F, 2034F, $ Million
    • Table 51: Malaysia Water And Sewage Market, Segmentation By Operator, Historic And Forecast, 2019 – 2024, 2029F, 2034F, $ Million
    • Table 52: Malaysia Water And Sewage Market, Segmentation By End User, Historic And Forecast, 2019 – 2024, 2029F, 2034F, $ Million
    • Table 53: Singapore Water And Sewage Market, Segmentation By Type, Historic And Forecast, 2019 – 2024, 2029F, 2034F, $ Million
    • Table 54: Singapore Water And Sewage Market, Segmentation By Operator, Historic And Forecast, 2019 – 2024, 2029F, 2034F, $ Million
    • Table 55: Singapore Water And Sewage Market, Segmentation By End User, Historic And Forecast, 2019 – 2024, 2029F, 2034F, $ Million
    • Table 56: Philippines Water And Sewage Market, Segmentation By Type, Historic And Forecast, 2019 – 2024, 2029F, 2034F, $ Million
    • Table 57: Philippines Water And Sewage Market, Segmentation By Operator, Historic And Forecast, 2019 – 2024, 2029F, 2034F, $ Million
    • Table 58: Philippines Water And Sewage Market, Segmentation By End User, Historic And Forecast, 2019 – 2024, 2029F, 2034F, $ Million
    • Table 59: Hong Kong Water And Sewage Market, Segmentation By Type, Historic And Forecast, 2019 – 2024, 2029F, 2034F, $ Million
    • Table 60: Hong Kong Water And Sewage Market, Segmentation By Operator, Historic And Forecast, 2019 – 2024, 2029F, 2034F, $ Million
    • Table 61: Hong Kong Water And Sewage Market, Segmentation By End User, Historic And Forecast, 2019 – 2024, 2029F, 2034F, $ Million
    • Table 62: New Zealand Water And Sewage Market, Segmentation By Type, Historic And Forecast, 2019 – 2024, 2029F, 2034F, $ Million
    • Table 63: New Zealand Water And Sewage Market, Segmentation By Operator, Historic And Forecast, 2019 – 2024, 2029F, 2034F, $ Million
    • Table 64: New Zealand Water And Sewage Market, Segmentation By End User, Historic And Forecast, 2019 – 2024, 2029F, 2034F, $ Million
    • Table 65: Western Europe GDP Per Capita, By Country, 2019-2024, $
    • Table 66:  Western Europe Population, By Country, 2019-2029, Millions
    • Table 67: Western Europe Water And Sewage Market, Segmentation By Type, Historic And Forecast, 2019 – 2024, 2029F, 2034F, $ Million
    • Table 68: Western Europe Water And Sewage Market, Segmentation By Operator, Historic And Forecast, 2019 – 2024, 2029F, 2034F, $ Million
    • Table 69: Western Europe Water And Sewage Market, Segmentation By End User, Historic And Forecast, 2019 – 2024, 2029F, 2034F, $ Million
    • Table 70: UK Water And Sewage Market, Segmentation By Type, Historic And Forecast, 2019 – 2024, 2029F, 2034F, $ Million
    • Table 71: UK Water And Sewage Market, Segmentation By Operator, Historic And Forecast, 2019 – 2024, 2029F, 2034F, $ Million
    • Table 72: UK Water And Sewage Market, Segmentation By End User, Historic And Forecast, 2019 – 2024, 2029F, 2034F, $ Million
    • Table 73: Germany Water And Sewage Market, Segmentation By Type, Historic And Forecast, 2019 – 2024, 2029F, 2034F, $ Million
    • Table 74: Germany Water And Sewage Market, Segmentation By Operator, Historic And Forecast, 2019 – 2024, 2029F, 2034F, $ Million
    • Table 75: Germany Water And Sewage Market, Segmentation By End User, Historic And Forecast, 2019 – 2024, 2029F, 2034F, $ Million
    • Table 76: France Water And Sewage Market, Segmentation By Type, Historic And Forecast, 2019 – 2024, 2029F, 2034F, $ Million
    • Table 77: France Water And Sewage Market, Segmentation By Operator, Historic And Forecast, 2019 – 2024, 2029F, 2034F, $ Million
    • Table 78: France Water And Sewage Market, Segmentation By End User, Historic And Forecast, 2019 – 2024, 2029F, 2034F, $ Million
    • Table 79: Italy Water And Sewage Market, Segmentation By Type, Historic And Forecast, 2019 – 2024, 2029F, 2034F, $ Million
    • Table 80: Italy Water And Sewage Market, Segmentation By Operator, Historic And Forecast, 2019 – 2024, 2029F, 2034F, $ Million
    • Table 81: Italy Water And Sewage Market, Segmentation By End User, Historic And Forecast, 2019 – 2024, 2029F, 2034F, $ Million
    • Table 82: Spain Water And Sewage Market, Segmentation By Type, Historic And Forecast, 2019 – 2024, 2029F, 2034F, $ Million
    • Table 83: Spain Water And Sewage Market, Segmentation By Operator, Historic And Forecast, 2019 – 2024, 2029F, 2034F, $ Million
    • Table 84: Spain Water And Sewage Market, Segmentation By End User, Historic And Forecast, 2019 – 2024, 2029F, 2034F, $ Million
    • Table 85: Austria Water And Sewage Market, Segmentation By Type, Historic And Forecast, 2019 – 2024, 2029F, 2034F, $ Million
    • Table 86: Austria Water And Sewage Market, Segmentation By Operator, Historic And Forecast, 2019 – 2024, 2029F, 2034F, $ Million
    • Table 87: Austria Water And Sewage Market, Segmentation By End User, Historic And Forecast, 2019 – 2024, 2029F, 2034F, $ Million
    • Table 88: Belgium Water And Sewage Market, Segmentation By Type, Historic And Forecast, 2019 – 2024, 2029F, 2034F, $ Million
    • Table 89: Belgium Water And Sewage Market, Segmentation By Operator, Historic And Forecast, 2019 – 2024, 2029F, 2034F, $ Million
    • Table 90: Belgium Water And Sewage Market, Segmentation By End User, Historic And Forecast, 2019 – 2024, 2029F, 2034F, $ Million
    • Table 91: Denmark Water And Sewage Market, Segmentation By Type, Historic And Forecast, 2019 – 2024, 2029F, 2034F, $ Million
    • Table 92: Denmark Water And Sewage Market, Segmentation By Operator, Historic And Forecast, 2019 – 2024, 2029F, 2034F, $ Million
    • Table 93: Denmark Water And Sewage Market, Segmentation By End User, Historic And Forecast, 2019 – 2024, 2029F, 2034F, $ Million
    • Table 94: Finland Water And Sewage Market, Segmentation By Type, Historic And Forecast, 2019 – 2024, 2029F, 2034F, $ Million
    • Table 95: Finland Water And Sewage Market, Segmentation By Operator, Historic And Forecast, 2019 – 2024, 2029F, 2034F, $ Million
    • Table 96: Finland Water And Sewage Market, Segmentation By End User, Historic And Forecast, 2019 – 2024, 2029F, 2034F, $ Million
    • Table 97: Ireland Water And Sewage Market, Segmentation By Type, Historic And Forecast, 2019 – 2024, 2029F, 2034F, $ Million
    • Table 98: Ireland Water And Sewage Market, Segmentation By Operator, Historic And Forecast, 2019 – 2024, 2029F, 2034F, $ Million
    • Table 99: Ireland Water And Sewage Market, Segmentation By End User, Historic And Forecast, 2019 – 2024, 2029F, 2034F, $ Million
    • Table 100: Netherlands Water And Sewage Market, Segmentation By Type, Historic And Forecast, 2019 – 2024, 2029F, 2034F, $ Million
    • Table 101: Netherlands Water And Sewage Market, Segmentation By Operator, Historic And Forecast, 2019 – 2024, 2029F, 2034F, $ Million
    • Table 102: Netherlands Water And Sewage Market, Segmentation By End User, Historic And Forecast, 2019 – 2024, 2029F, 2034F, $ Million
    • Table 103: Norway Water And Sewage Market, Segmentation By Type, Historic And Forecast, 2019 – 2024, 2029F, 2034F, $ Million
    • Table 104: Norway Water And Sewage Market, Segmentation By Operator, Historic And Forecast, 2019 – 2024, 2029F, 2034F, $ Million
    • Table 105: Norway Water And Sewage Market, Segmentation By End User, Historic And Forecast, 2019 – 2024, 2029F, 2034F, $ Million
    • Table 106: Portugal Water And Sewage Market, Segmentation By Type, Historic And Forecast, 2019 – 2024, 2029F, 2034F, $ Million
    • Table 107: Portugal Water And Sewage Market, Segmentation By Operator, Historic And Forecast, 2019 – 2024, 2029F, 2034F, $ Million
    • Table 108: Portugal Water And Sewage Market, Segmentation By End User, Historic And Forecast, 2019 – 2024, 2029F, 2034F, $ Million
    • Table 109: Sweden Water And Sewage Market, Segmentation By Type, Historic And Forecast, 2019 – 2024, 2029F, 2034F, $ Million
    • Table 110: Sweden Water And Sewage Market, Segmentation By Operator, Historic And Forecast, 2019 – 2024, 2029F, 2034F, $ Million
    • Table 111: Sweden Water And Sewage Market, Segmentation By End User, Historic And Forecast, 2019 – 2024, 2029F, 2034F, $ Million
    • Table 112: Switzerland Water And Sewage Market, Segmentation By Type, Historic And Forecast, 2019 – 2024, 2029F, 2034F, $ Million
    • Table 113: Switzerland Water And Sewage Market, Segmentation By Operator, Historic And Forecast, 2019 – 2024, 2029F, 2034F, $ Million
    • Table 114: Switzerland Water And Sewage Market, Segmentation By End User, Historic And Forecast, 2019 – 2024, 2029F, 2034F, $ Million
    • Table 115: Eastern Europe GDP Per Capita, By Country, 2019-2024, $
    • Table 116:  Eastern Europe Population, By Country, 2019-2029, Millions
    • Table 117: Eastern Europe Water And Sewage Market, Segmentation By Type, Historic And Forecast, 2019 – 2024, 2029F, 2034F, $ Million
    • Table 118: Eastern Europe Water And Sewage Market, Segmentation By Operator, Historic And Forecast, 2019 – 2024, 2029F, 2034F, $ Million
    • Table 119: Eastern Europe Water And Sewage Market, Segmentation By End User, Historic And Forecast, 2019 – 2024, 2029F, 2034F, $ Million
    • Table 120: Russia Water And Sewage Market, Segmentation By Type, Historic And Forecast, 2019 – 2024, 2029F, 2034F, $ Million
    • Table 121: Russia Water And Sewage Market, Segmentation By Operator, Historic And Forecast, 2019 – 2024, 2029F, 2034F, $ Million
    • Table 122: Russia Water And Sewage Market, Segmentation By End User, Historic And Forecast, 2019 – 2024, 2029F, 2034F, $ Million
    • Table 123: Czech Republic Water And Sewage Market, Segmentation By Type, Historic And Forecast, 2019 – 2024, 2029F, 2034F, $ Million
    • Table 124: Czech Republic Water And Sewage Market, Segmentation By Operator, Historic And Forecast, 2019 – 2024, 2029F, 2034F, $ Million
    • Table 125: Czech Republic Water And Sewage Market, Segmentation By End User, Historic And Forecast, 2019 – 2024, 2029F, 2034F, $ Million
    • Table 126: Poland Water And Sewage Market, Segmentation By Type, Historic And Forecast, 2019 – 2024, 2029F, 2034F, $ Million
    • Table 127: Poland Water And Sewage Market, Segmentation By Operator, Historic And Forecast, 2019 – 2024, 2029F, 2034F, $ Million
    • Table 128: Poland Water And Sewage Market, Segmentation By End User, Historic And Forecast, 2019 – 2024, 2029F, 2034F, $ Million
    • Table 129: Romania Water And Sewage Market, Segmentation By Type, Historic And Forecast, 2019 – 2024, 2029F, 2034F, $ Million
    • Table 130: Romania Water And Sewage Market, Segmentation By Operator, Historic And Forecast, 2019 – 2024, 2029F, 2034F, $ Million
    • Table 131: Romania Water And Sewage Market, Segmentation By End User, Historic And Forecast, 2019 – 2024, 2029F, 2034F, $ Million
    • Table 132: Ukraine Water And Sewage Market, Segmentation By Type, Historic And Forecast, 2019 – 2024, 2029F, 2034F, $ Million
    • Table 133: Ukraine Water And Sewage Market, Segmentation By Operator, Historic And Forecast, 2019 – 2024, 2029F, 2034F, $ Million
    • Table 134: Ukraine Water And Sewage Market, Segmentation By End User, Historic And Forecast, 2019 – 2024, 2029F, 2034F, $ Million
    • Table 135: North America GDP Per Capita, By Country, 2019-2024, $
    • Table 136:  North America Population, By Country, 2019-2029, Millions
    • Table 137: North America Water And Sewage Market, Segmentation By Type, Historic And Forecast, 2019 – 2024, 2029F, 2034F, $ Million
    • Table 138: North America Water And Sewage Market, Segmentation By Operator, Historic And Forecast, 2019 – 2024, 2029F, 2034F, $ Million
    • Table 139: North America Water And Sewage Market, Segmentation By End User, Historic And Forecast, 2019 – 2024, 2029F, 2034F, $ Million
    • Table 140: USA GDP Per Capita, 2019-2024, $
    • Table 141:  USA Population, 2019-2029, Millions
    • Table 142: USA Water And Sewage Market, Segmentation By Type, Historic And Forecast, 2019 – 2024, 2029F, 2034F, $ Million
    • Table 143: USA Water And Sewage Market, Segmentation By Operator, Historic And Forecast, 2019 – 2024, 2029F, 2034F, $ Million
    • Table 144: USA Water And Sewage Market, Segmentation By End User, Historic And Forecast, 2019 – 2024, 2029F, 2034F, $ Million
    • Table 145: Canada GDP Per Capita, 2019-2024, $
    • Table 146:  Canada Population, By Country, 2019-2029, Millions
    • Table 147: Canada Water And Sewage Market, Segmentation By Type, Historic And Forecast, 2019 – 2024, 2029F, 2034F, $ Million
    • Table 148: Canada Water And Sewage Market, Segmentation By Operator, Historic And Forecast, 2019 – 2024, 2029F, 2034F, $ Million
    • Table 149: Canada Water And Sewage Market, Segmentation By End User, Historic And Forecast, 2019 – 2024, 2029F, 2034F, $ Million
    • Table 150: Mexico Water And Sewage Market, Segmentation By Type, Historic And Forecast, 2019 – 2024, 2029F, 2034F, $ Million
    • Table 151: Mexico Water And Sewage Market, Segmentation By Operator, Historic And Forecast, 2019 – 2024, 2029F, 2034F, $ Million
    • Table 152: Mexico Water And Sewage Market, Segmentation By End User, Historic And Forecast, 2019 – 2024, 2029F, 2034F, $ Million
    • Table 153: South America GDP Per Capita, By Country, 2019-2024, $
    • Table 154:  South America Population, By Country, 2019-2029, Millions
    • Table 155: South America Water And Sewage Market, Segmentation By Type, Historic And Forecast, 2019 – 2024, 2029F, 2034F, $ Million
    • Table 156: South America Water And Sewage Market, Segmentation By Operator, Historic And Forecast, 2019 – 2024, 2029F, 2034F, $ Million
    • Table 157: South America Water And Sewage Market, Segmentation By End User, Historic And Forecast, 2019 – 2024, 2029F, 2034F, $ Million
    • Table 158: Brazil Water And Sewage Market, Segmentation By Type, Historic And Forecast, 2019 – 2024, 2029F, 2034F, $ Million
    • Table 159: Brazil Water And Sewage Market, Segmentation By Operator, Historic And Forecast, 2019 – 2024, 2029F, 2034F, $ Million
    • Table 160: Brazil Water And Sewage Market, Segmentation By End User, Historic And Forecast, 2019 – 2024, 2029F, 2034F, $ Million
    • Table 161: Chile Water And Sewage Market, Segmentation By Type, Historic And Forecast, 2019 – 2024, 2029F, 2034F, $ Million
    • Table 162: Chile Water And Sewage Market, Segmentation By Operator, Historic And Forecast, 2019 – 2024, 2029F, 2034F, $ Million
    • Table 163: Chile Water And Sewage Market, Segmentation By End User, Historic And Forecast, 2019 – 2024, 2029F, 2034F, $ Million
    • Table 164: Argentina Water And Sewage Market, Segmentation By Type, Historic And Forecast, 2019 – 2024, 2029F, 2034F, $ Million
    • Table 165: Argentina Water And Sewage Market, Segmentation By Operator, Historic And Forecast, 2019 – 2024, 2029F, 2034F, $ Million
    • Table 166: Argentina Water And Sewage Market, Segmentation By End User, Historic And Forecast, 2019 – 2024, 2029F, 2034F, $ Million
    • Table 167: Colombia Water And Sewage Market, Segmentation By Type, Historic And Forecast, 2019 – 2024, 2029F, 2034F, $ Million
    • Table 168: Colombia Water And Sewage Market, Segmentation By Operator, Historic And Forecast, 2019 – 2024, 2029F, 2034F, $ Million
    • Table 169: Colombia Water And Sewage Market, Segmentation By End User, Historic And Forecast, 2019 – 2024, 2029F, 2034F, $ Million
    • Table 170: Peru Water And Sewage Market, Segmentation By Type, Historic And Forecast, 2019 – 2024, 2029F, 2034F, $ Million
    • Table 171: Peru Water And Sewage Market, Segmentation By Operator, Historic And Forecast, 2019 – 2024, 2029F, 2034F, $ Million
    • Table 172: Peru Water And Sewage Market, Segmentation By End User, Historic And Forecast, 2019 – 2024, 2029F, 2034F, $ Million
    • Table 173: Middle East GDP Per Capita, By Country, 2019-2024, $
    • Table 174:  Middle East Population, By Country, 2019-2029, Millions
    • Table 175: Middle East Water And Sewage Market, Segmentation By Type, Historic And Forecast, 2019 – 2024, 2029F, 2034F, $ Million
    • Table 176: Middle East Water And Sewage Market, Segmentation By Operator, Historic And Forecast, 2019 – 2024, 2029F, 2034F, $ Million
    • Table 177: Middle East Water And Sewage Market, Segmentation By End User, Historic And Forecast, 2019 – 2024, 2029F, 2034F, $ Million
    • Table 178: Saudi Arabia Water And Sewage Market, Segmentation By Type, Historic And Forecast, 2019 – 2024, 2029F, 2034F, $ Million
    • Table 179: Saudi Arabia Water And Sewage Market, Segmentation By Operator, Historic And Forecast, 2019 – 2024, 2029F, 2034F, $ Million
    • Table 180: Saudi Arabia Water And Sewage Market, Segmentation By End User, Historic And Forecast, 2019 – 2024, 2029F, 2034F, $ Million
    • Table 181: Israel Water And Sewage Market, Segmentation By Type, Historic And Forecast, 2019 – 2024, 2029F, 2034F, $ Million
    • Table 182: Israel Water And Sewage Market, Segmentation By Operator, Historic And Forecast, 2019 – 2024, 2029F, 2034F, $ Million
    • Table 183: Israel Water And Sewage Market, Segmentation By End User, Historic And Forecast, 2019 – 2024, 2029F, 2034F, $ Million
    • Table 184: Iran Water And Sewage Market, Segmentation By Type, Historic And Forecast, 2019 – 2024, 2029F, 2034F, $ Million
    • Table 185: Iran Water And Sewage Market, Segmentation By Operator, Historic And Forecast, 2019 – 2024, 2029F, 2034F, $ Million
    • Table 186: Iran Water And Sewage Market, Segmentation By End User, Historic And Forecast, 2019 – 2024, 2029F, 2034F, $ Million
    • Table 187: Turkey Water And Sewage Market, Segmentation By Type, Historic And Forecast, 2019 – 2024, 2029F, 2034F, $ Million
    • Table 188: Turkey Water And Sewage Market, Segmentation By Operator, Historic And Forecast, 2019 – 2024, 2029F, 2034F, $ Million
    • Table 189: Turkey Water And Sewage Market, Segmentation By End User, Historic And Forecast, 2019 – 2024, 2029F, 2034F, $ Million
    • Table 190: United Arab Emirates Water And Sewage Market, Segmentation By Type, Historic And Forecast, 2019 – 2024, 2029F, 2034F, $ Million
    • Table 191: United Arab Emirates Water And Sewage Market, Segmentation By Operator, Historic And Forecast, 2019 – 2024, 2029F, 2034F, $ Million
    • Table 192: United Arab Emirates Water And Sewage Market, Segmentation By End User, Historic And Forecast, 2019 – 2024, 2029F, 2034F, $ Million
    • Table 193: Africa GDP Per Capita, By Country, 2019-2024, $
    • Table 194:  Africa Population, By Country, 2019-2029, Millions
    • Table 195: Africa Water And Sewage Market, Segmentation By Type, Historic And Forecast, 2019 – 2024, 2029F, 2034F, $ Million
    • Table 196: Africa Water And Sewage Market, Segmentation By Operator, Historic And Forecast, 2019 – 2024, 2029F, 2034F, $ Million
    • Table 197: Africa Water And Sewage Market, Segmentation By End User, Historic And Forecast, 2019 – 2024, 2029F, 2034F, $ Million
    • Table 198: Egypt Water And Sewage Market, Segmentation By Type, Historic And Forecast, 2019 – 2024, 2029F, 2034F, $ Million
    • Table 199: Egypt Water And Sewage Market, Segmentation By Operator, Historic And Forecast, 2019 – 2024, 2029F, 2034F, $ Million
    • Table 200: Egypt Water And Sewage Market, Segmentation By End User, Historic And Forecast, 2019 – 2024, 2029F, 2034F, $ Million
    • Table 201: Nigeria Water And Sewage Market, Segmentation By Type, Historic And Forecast, 2019 – 2024, 2029F, 2034F, $ Million
    • Table 202: Nigeria Water And Sewage Market, Segmentation By Operator, Historic And Forecast, 2019 – 2024, 2029F, 2034F, $ Million
    • Table 203: Nigeria Water And Sewage Market, Segmentation By End User, Historic And Forecast, 2019 – 2024, 2029F, 2034F, $ Million
    • Table 204: South Africa Water And Sewage Market, Segmentation By Type, Historic And Forecast, 2019 – 2024, 2029F, 2034F, $ Million
    • Table 205: South Africa Water And Sewage Market, Segmentation By Operator, Historic And Forecast, 2019 – 2024, 2029F, 2034F, $ Million
    • Table 206: South Africa Water And Sewage Market, Segmentation By End User, Historic And Forecast, 2019 – 2024, 2029F, 2034F, $ Million
    • Table 207: Global Water And Sewage Market, Key Competitor Estimated Market Shares, 2023, Percentage (%)
    • Table 208: Veolia Environment SA – Financial Overview, 2019 – 2023, $ Billion
    • Table 209: Companhia de Saneamento Basico-Sabesp – Financial Overview, 2023, $ Billion
    • Table 210: American Water Works Company Inc. – Financial Overview, 2019 – 2023, $ Billion
    • Table 211: Water Corporation – Financial Overview, 2019 – 2023, $ Billion
    • Table 212: Thames Water Utilities Limited – Financial Overview, 2023, $ Billion
    • Table 213: Water And Sewage Market, Competitive Benchmarking (In USD Millions)
    • Table 214: Water And Sewage Market, Competitive Dashboard
    • Table 215: Global Water And Sewage Market Size Gain ($ Million), 2024 – 2029, By Country
    • Table 216: Global Water And Sewage Market Size Gain ($ Million), Segmentation By Type, 2024 – 2029
    • Table 217: Global Water And Sewage Market Size Gain ($ Million), Segmentation By Operator, 2024 – 2029
    • Table 218: Global Water And Sewage Market Size Gain ($ Million), Segmentation By End User, 2024 – 2029
    • Table 219: Water And Sewage Market Data Sources

    List Of Figures

      Figure 1: Global Water And Sewage Market Segmentation By Type
    • Figure 2: Global Water And Sewage Market Segmentation By Operator
    • Figure 3: Global Water And Sewage Market Segmentation By End User
    • Figure 4: Global Water And Sewage Market, PESTEL (Political, Economic, Social, Technology, Environmental and Legal) Analysis
    • Figure 5: Global Water And Sewage Market, Historic, 2019 – 2024, $ Million
    • Figure 6: Global Water And Sewage Market, Forecast, 2024 – 2029, 2034F, $ Million
    • Figure 7: Global Water And Sewage Market, Segmentation By Type, Historic And Forecast, 2019 – 2024, 2029F, 2034F, $ Million
    • Figure 8: Global Water And Sewage Market, Segmentation By Operator, Historic And Forecast, 2019 – 2024, 2029F, 2034F, $ Million
    • Figure 9: Global Water And Sewage Market, Segmentation By End User, Historic And Forecast, 2019 – 2024, 2029F, 2034F, $ Million
    • Figure 10: Global Water And Sewage Market, Sub-Segmentation Of Water Supply And Irrigation Systems, By Type, Historic And Forecast, 2019 – 2024, 2029F, 2034F, $ Million
    • Figure 11: Global Water And Sewage Market, Sub-Segmentation Of Sewage Treatment Facilities, By Type, Historic And Forecast, 2019 – 2024, 2029F, 2034F, $ Million
    • Figure 12: Global Water And Sewage Market, Sub-Segmentation Of Steam And Air Conditioning Supply, By Type, Historic And Forecast, 2019 – 2024, 2029F, 2034F, $ Million
    • Figure 13: Global Water And Sewage Market, By Region, Historic and Forecast, 2019 – 2024, 2029F, 2034F, $ Million
    • Figure 14: Global Water And Sewage Market, By Country, Historic and Forecast, 2019 – 2024, 2029F, 2034F, $ Million
    • Figure 15: Asia-Pacific Water And Sewage Market, Segmentation By Type, Historic And Forecast, 2019 – 2024, 2029F, 2034F, $ Million
    • Figure 16: Asia-Pacific Water And Sewage Market, Segmentation By Operator, Historic And Forecast, 2019 – 2024, 2029F, 2034F, $ Million
    • Figure 17: Asia-Pacific Water And Sewage Market, Segmentation By End User, Historic And Forecast, 2019 – 2024, 2029F, 2034F, $ Million
    • Figure 18: China Water And Sewage Market, Segmentation By Type, Historic And Forecast, 2019 – 2024, 2029F, 2034F, $ Million
    • Figure 19: China Water And Sewage Market, Segmentation By Operator, Historic And Forecast, 2019 – 2024, 2029F, 2034F, $ Million
    • Figure 20: China Water And Sewage Market, Segmentation By End User, Historic And Forecast, 2019 – 2024, 2029F, 2034F, $ Million
    • Figure 21: India Water And Sewage Market, Segmentation By Type, Historic And Forecast, 2019 – 2024, 2029F, 2034F, $ Million
    • Figure 22: India Water And Sewage Market, Segmentation By Operator, Historic And Forecast, 2019 – 2024, 2029F, 2034F, $ Million
    • Figure 23: India Water And Sewage Market, Segmentation By End User, Historic And Forecast, 2019 – 2024, 2029F, 2034F, $ Million
    • Figure 24: Japan Water And Sewage Market, Segmentation By Type, Historic And Forecast, 2019 – 2024, 2029F, 2034F, $ Million
    • Figure 25: Japan Water And Sewage Market, Segmentation By Operator, Historic And Forecast, 2019 – 2024, 2029F, 2034F, $ Million
    • Figure 26: Japan Water And Sewage Market, Segmentation By End User, Historic And Forecast, 2019 – 2024, 2029F, 2034F, $ Million
    • Figure 27: Australia Water And Sewage Market, Segmentation By Type, Historic And Forecast, 2019 – 2024, 2029F, 2034F, $ Million
    • Figure 28: Australia Water And Sewage Market, Segmentation By Operator, Historic And Forecast, 2019 – 2024, 2029F, 2034F, $ Million
    • Figure 29: Australia Water And Sewage Market, Segmentation By End User, Historic And Forecast, 2019 – 2024, 2029F, 2034F, $ Million
    • Figure 30: Indonesia Water And Sewage Market, Segmentation By Type, Historic And Forecast, 2019 – 2024, 2029F, 2034F, $ Million
    • Figure 31: Indonesia Water And Sewage Market, Segmentation By Operator, Historic And Forecast, 2019 – 2024, 2029F, 2034F, $ Million
    • Figure 32: Indonesia Water And Sewage Market, Segmentation By End User, Historic And Forecast, 2019 – 2024, 2029F, 2034F, $ Million
    • Figure 33: South Korea Water And Sewage Market, Segmentation By Type, Historic And Forecast, 2019 – 2024, 2029F, 2034F, $ Million
    • Figure 34: South Korea Water And Sewage Market, Segmentation By Operator, Historic And Forecast, 2019 – 2024, 2029F, 2034F, $ Million
    • Figure 35: South Korea Water And Sewage Market, Segmentation By End User, Historic And Forecast, 2019 – 2024, 2029F, 2034F, $ Million
    • Figure 36: Bangladesh Water And Sewage Market, Segmentation By Type, Historic And Forecast, 2019 – 2024, 2029F, 2034F, $ Million
    • Figure 37: Bangladesh Water And Sewage Market, Segmentation By Operator, Historic And Forecast, 2019 – 2024, 2029F, 2034F, $ Million
    • Figure 38: Bangladesh Water And Sewage Market, Segmentation By End User, Historic And Forecast, 2019 – 2024, 2029F, 2034F, $ Million
    • Figure 39: Thailand Water And Sewage Market, Segmentation By Type, Historic And Forecast, 2019 – 2024, 2029F, 2034F, $ Million
    • Figure 40: Thailand Water And Sewage Market, Segmentation By Operator, Historic And Forecast, 2019 – 2024, 2029F, 2034F, $ Million
    • Figure 41: Thailand Water And Sewage Market, Segmentation By End User, Historic And Forecast, 2019 – 2024, 2029F, 2034F, $ Million
    • Figure 42: Vietnam Water And Sewage Market, Segmentation By Type, Historic And Forecast, 2019 – 2024, 2029F, 2034F, $ Million
    • Figure 43: Vietnam Water And Sewage Market, Segmentation By Operator, Historic And Forecast, 2019 – 2024, 2029F, 2034F, $ Million
    • Figure 44: Vietnam Water And Sewage Market, Segmentation By End User, Historic And Forecast, 2019 – 2024, 2029F, 2034F, $ Million
    • Figure 45: Malaysia Water And Sewage Market, Segmentation By Type, Historic And Forecast, 2019 – 2024, 2029F, 2034F, $ Million
    • Figure 46: Malaysia Water And Sewage Market, Segmentation By Operator, Historic And Forecast, 2019 – 2024, 2029F, 2034F, $ Million
    • Figure 47: Malaysia Water And Sewage Market, Segmentation By End User, Historic And Forecast, 2019 – 2024, 2029F, 2034F, $ Million
    • Figure 48: Singapore Water And Sewage Market, Segmentation By Type, Historic And Forecast, 2019 – 2024, 2029F, 2034F, $ Million
    • Figure 49: Singapore Water And Sewage Market, Segmentation By Operator, Historic And Forecast, 2019 – 2024, 2029F, 2034F, $ Million
    • Figure 50: Singapore Water And Sewage Market, Segmentation By End User, Historic And Forecast, 2019 – 2024, 2029F, 2034F, $ Million
    • Figure 51: Philippines Water And Sewage Market, Segmentation By Type, Historic And Forecast, 2019 – 2024, 2029F, 2034F, $ Million
    • Figure 52: Philippines Water And Sewage Market, Segmentation By Operator, Historic And Forecast, 2019 – 2024, 2029F, 2034F, $ Million
    • Figure 53: Philippines Water And Sewage Market, Segmentation By End User, Historic And Forecast, 2019 – 2024, 2029F, 2034F, $ Million
    • Figure 54: Hong Kong Water And Sewage Market, Segmentation By Type, Historic And Forecast, 2019 – 2024, 2029F, 2034F, $ Million
    • Figure 55: Hong Kong Water And Sewage Market, Segmentation By Operator, Historic And Forecast, 2019 – 2024, 2029F, 2034F, $ Million
    • Figure 56: Hong Kong Water And Sewage Market, Segmentation By End User, Historic And Forecast, 2019 – 2024, 2029F, 2034F, $ Million
    • Figure 57: New Zealand Water And Sewage Market, Segmentation By Type, Historic And Forecast, 2019 – 2024, 2029F, 2034F, $ Million
    • Figure 58: New Zealand Water And Sewage Market, Segmentation By Operator, Historic And Forecast, 2019 – 2024, 2029F, 2034F, $ Million
    • Figure 59: New Zealand Water And Sewage Market, Segmentation By End User, Historic And Forecast, 2019 – 2024, 2029F, 2034F, $ Million
    • Figure 60: Western Europe Water And Sewage Market, Segmentation By Type, Historic And Forecast, 2019 – 2024, 2029F, 2034F, $ Million
    • Figure 61: Western Europe Water And Sewage Market, Segmentation By Operator, Historic And Forecast, 2019 – 2024, 2029F, 2034F, $ Million
    • Figure 62: Western Europe Water And Sewage Market, Segmentation By End User, Historic And Forecast, 2019 – 2024, 2029F, 2034F, $ Million
    • Figure 63: UK Water And Sewage Market, Segmentation By Type, Historic And Forecast, 2019 – 2024, 2029F, 2034F, $ Million
    • Figure 64: UK Water And Sewage Market, Segmentation By Operator, Historic And Forecast, 2019 – 2024, 2029F, 2034F, $ Million
    • Figure 65: UK Water And Sewage Market, Segmentation By End User, Historic And Forecast, 2019 – 2024, 2029F, 2034F, $ Million
    • Figure 66: Germany Water And Sewage Market, Segmentation By Type, Historic And Forecast, 2019 – 2024, 2029F, 2034F, $ Million
    • Figure 67: Germany Water And Sewage Market, Segmentation By Operator, Historic And Forecast, 2019 – 2024, 2029F, 2034F, $ Million
    • Figure 68: Germany Water And Sewage Market, Segmentation By End User, Historic And Forecast, 2019 – 2024, 2029F, 2034F, $ Million
    • Figure 69: France Water And Sewage Market, Segmentation By Type, Historic And Forecast, 2019 – 2024, 2029F, 2034F, $ Million
    • Figure 70: France Water And Sewage Market, Segmentation By Operator, Historic And Forecast, 2019 – 2024, 2029F, 2034F, $ Million
    • Figure 71: France Water And Sewage Market, Segmentation By End User, Historic And Forecast, 2019 – 2024, 2029F, 2034F, $ Million
    • Figure 72: Italy Water And Sewage Market, Segmentation By Type, Historic And Forecast, 2019 – 2024, 2029F, 2034F, $ Million
    • Figure 73: Italy Water And Sewage Market, Segmentation By Operator, Historic And Forecast, 2019 – 2024, 2029F, 2034F, $ Million
    • Figure 74: Italy Water And Sewage Market, Segmentation By End User, Historic And Forecast, 2019 – 2024, 2029F, 2034F, $ Million
    • Figure 75: Spain Water And Sewage Market, Segmentation By Type, Historic And Forecast, 2019 – 2024, 2029F, 2034F, $ Million
    • Figure 76: Spain Water And Sewage Market, Segmentation By Operator, Historic And Forecast, 2019 – 2024, 2029F, 2034F, $ Million
    • Figure 77: Spain Water And Sewage Market, Segmentation By End User, Historic And Forecast, 2019 – 2024, 2029F, 2034F, $ Million
    • Figure 78: Austria Water And Sewage Market, Segmentation By Type, Historic And Forecast, 2019 – 2024, 2029F, 2034F, $ Million
    • Figure 79: Austria Water And Sewage Market, Segmentation By Operator, Historic And Forecast, 2019 – 2024, 2029F, 2034F, $ Million
    • Figure 80: Austria Water And Sewage Market, Segmentation By End User, Historic And Forecast, 2019 – 2024, 2029F, 2034F, $ Million
    • Figure 81: Belgium Water And Sewage Market, Segmentation By Type, Historic And Forecast, 2019 – 2024, 2029F, 2034F, $ Million
    • Figure 82: Belgium Water And Sewage Market, Segmentation By Operator, Historic And Forecast, 2019 – 2024, 2029F, 2034F, $ Million
    • Figure 83: Belgium Water And Sewage Market, Segmentation By End User, Historic And Forecast, 2019 – 2024, 2029F, 2034F, $ Million
    • Figure 84: Denmark Water And Sewage Market, Segmentation By Type, Historic And Forecast, 2019 – 2024, 2029F, 2034F, $ Million
    • Figure 85: Denmark Water And Sewage Market, Segmentation By Operator, Historic And Forecast, 2019 – 2024, 2029F, 2034F, $ Million
    • Figure 86: Denmark Water And Sewage Market, Segmentation By End User, Historic And Forecast, 2019 – 2024, 2029F, 2034F, $ Million
    • Figure 87: Finland Water And Sewage Market, Segmentation By Type, Historic And Forecast, 2019 – 2024, 2029F, 2034F, $ Million
    • Figure 88: Finland Water And Sewage Market, Segmentation By Operator, Historic And Forecast, 2019 – 2024, 2029F, 2034F, $ Million
    • Figure 89: Finland Water And Sewage Market, Segmentation By End User, Historic And Forecast, 2019 – 2024, 2029F, 2034F, $ Million
    • Figure 90: Ireland Water And Sewage Market, Segmentation By Type, Historic And Forecast, 2019 – 2024, 2029F, 2034F, $ Million
    • Figure 91: Ireland Water And Sewage Market, Segmentation By Operator, Historic And Forecast, 2019 – 2024, 2029F, 2034F, $ Million
    • Figure 92: Ireland Water And Sewage Market, Segmentation By End User, Historic And Forecast, 2019 – 2024, 2029F, 2034F, $ Million
    • Figure 93: Netherlands Water And Sewage Market, Segmentation By Type, Historic And Forecast, 2019 – 2024, 2029F, 2034F, $ Million
    • Figure 94: Netherlands Water And Sewage Market, Segmentation By Operator, Historic And Forecast, 2019 – 2024, 2029F, 2034F, $ Million
    • Figure 95: Netherlands Water And Sewage Market, Segmentation By End User, Historic And Forecast, 2019 – 2024, 2029F, 2034F, $ Million
    • Figure 96: Norway Water And Sewage Market, Segmentation By Type, Historic And Forecast, 2019 – 2024, 2029F, 2034F, $ Million
    • Figure 97: Norway Water And Sewage Market, Segmentation By Operator, Historic And Forecast, 2019 – 2024, 2029F, 2034F, $ Million
    • Figure 98: Norway Water And Sewage Market, Segmentation By End User, Historic And Forecast, 2019 – 2024, 2029F, 2034F, $ Million
    • Figure 99: Portugal Water And Sewage Market, Segmentation By Type, Historic And Forecast, 2019 – 2024, 2029F, 2034F, $ Million
    • Figure 100: Portugal Water And Sewage Market, Segmentation By Operator, Historic And Forecast, 2019 – 2024, 2029F, 2034F, $ Million
    • Figure 101: Portugal Water And Sewage Market, Segmentation By End User, Historic And Forecast, 2019 – 2024, 2029F, 2034F, $ Million
    • Figure 102: Sweden Water And Sewage Market, Segmentation By Type, Historic And Forecast, 2019 – 2024, 2029F, 2034F, $ Million
    • Figure 103: Sweden Water And Sewage Market, Segmentation By Operator, Historic And Forecast, 2019 – 2024, 2029F, 2034F, $ Million
    • Figure 104: Sweden Water And Sewage Market, Segmentation By End User, Historic And Forecast, 2019 – 2024, 2029F, 2034F, $ Million
    • Figure 105: Switzerland Water And Sewage Market, Segmentation By Type, Historic And Forecast, 2019 – 2024, 2029F, 2034F, $ Million
    • Figure 106: Switzerland Water And Sewage Market, Segmentation By Operator, Historic And Forecast, 2019 – 2024, 2029F, 2034F, $ Million
    • Figure 107: Switzerland Water And Sewage Market, Segmentation By End User, Historic And Forecast, 2019 – 2024, 2029F, 2034F, $ Million
    • Figure 108: Eastern Europe Water And Sewage Market, Segmentation By Type, Historic And Forecast, 2019 – 2024, 2029F, 2034F, $ Million
    • Figure 109: Eastern Europe Water And Sewage Market, Segmentation By Operator, Historic And Forecast, 2019 – 2024, 2029F, 2034F, $ Million
    • Figure 110: Eastern Europe Water And Sewage Market, Segmentation By End User, Historic And Forecast, 2019 – 2024, 2029F, 2034F, $ Million
    • Figure 111: Russia Water And Sewage Market, Segmentation By Type, Historic And Forecast, 2019 – 2024, 2029F, 2034F, $ Million
    • Figure 112: Russia Water And Sewage Market, Segmentation By Operator, Historic And Forecast, 2019 – 2024, 2029F, 2034F, $ Million
    • Figure 113: Russia Water And Sewage Market, Segmentation By End User, Historic And Forecast, 2019 – 2024, 2029F, 2034F, $ Million
    • Figure 114: Czech Republic Water And Sewage Market, Segmentation By Type, Historic And Forecast, 2019 – 2024, 2029F, 2034F, $ Million
    • Figure 115: Czech Republic Water And Sewage Market, Segmentation By Operator, Historic And Forecast, 2019 – 2024, 2029F, 2034F, $ Million
    • Figure 116: Czech Republic Water And Sewage Market, Segmentation By End User, Historic And Forecast, 2019 – 2024, 2029F, 2034F, $ Million
    • Figure 117: Poland Water And Sewage Market, Segmentation By Type, Historic And Forecast, 2019 – 2024, 2029F, 2034F, $ Million
    • Figure 118: Poland Water And Sewage Market, Segmentation By Operator, Historic And Forecast, 2019 – 2024, 2029F, 2034F, $ Million
    • Figure 119: Poland Water And Sewage Market, Segmentation By End User, Historic And Forecast, 2019 – 2024, 2029F, 2034F, $ Million
    • Figure 120: Romania Water And Sewage Market, Segmentation By Type, Historic And Forecast, 2019 – 2024, 2029F, 2034F, $ Million
    • Figure 121: Romania Water And Sewage Market, Segmentation By Operator, Historic And Forecast, 2019 – 2024, 2029F, 2034F, $ Million
    • Figure 122: Romania Water And Sewage Market, Segmentation By End User, Historic And Forecast, 2019 – 2024, 2029F, 2034F, $ Million
    • Figure 123: Ukraine Water And Sewage Market, Segmentation By Type, Historic And Forecast, 2019 – 2024, 2029F, 2034F, $ Million
    • Figure 124: Ukraine Water And Sewage Market, Segmentation By Operator, Historic And Forecast, 2019 – 2024, 2029F, 2034F, $ Million
    • Figure 125: Ukraine Water And Sewage Market, Segmentation By End User, Historic And Forecast, 2019 – 2024, 2029F, 2034F, $ Million
    • Figure 126: North America Water And Sewage Market, Segmentation By Type, Historic And Forecast, 2019 – 2024, 2029F, 2034F, $ Million
    • Figure 127: North America Water And Sewage Market, Segmentation By Operator, Historic And Forecast, 2019 – 2024, 2029F, 2034F, $ Million
    • Figure 128: North America Water And Sewage Market, Segmentation By End User, Historic And Forecast, 2019 – 2024, 2029F, 2034F, $ Million
    • Figure 129: USA Water And Sewage Market, Segmentation By Type, Historic And Forecast, 2019 – 2024, 2029F, 2034F, $ Million
    • Figure 130: USA Water And Sewage Market, Segmentation By Operator, Historic And Forecast, 2019 – 2024, 2029F, 2034F, $ Million
    • Figure 131: USA Water And Sewage Market, Segmentation By End User, Historic And Forecast, 2019 – 2024, 2029F, 2034F, $ Million
    • Figure 132: Canada Water And Sewage Market, Segmentation By Type, Historic And Forecast, 2019 – 2024, 2029F, 2034F, $ Million
    • Figure 133: Canada Water And Sewage Market, Segmentation By Operator, Historic And Forecast, 2019 – 2024, 2029F, 2034F, $ Million
    • Figure 134: Canada Water And Sewage Market, Segmentation By End User, Historic And Forecast, 2019 – 2024, 2029F, 2034F, $ Million
    • Figure 135: Mexico Water And Sewage Market, Segmentation By Type, Historic And Forecast, 2019 – 2024, 2029F, 2034F, $ Million
    • Figure 136: Mexico Water And Sewage Market, Segmentation By Operator, Historic And Forecast, 2019 – 2024, 2029F, 2034F, $ Million
    • Figure 137: Mexico Water And Sewage Market, Segmentation By End User, Historic And Forecast, 2019 – 2024, 2029F, 2034F, $ Million
    • Figure 138: South America Water And Sewage Market, Segmentation By Type, Historic And Forecast, 2019 – 2024, 2029F, 2034F, $ Million
    • Figure 139: South America Water And Sewage Market, Segmentation By Operator, Historic And Forecast, 2019 – 2024, 2029F, 2034F, $ Million
    • Figure 140: South America Water And Sewage Market, Segmentation By End User, Historic And Forecast, 2019 – 2024, 2029F, 2034F, $ Million
    • Figure 141: Brazil Water And Sewage Market, Segmentation By Type, Historic And Forecast, 2019 – 2024, 2029F, 2034F, $ Million
    • Figure 142: Brazil Water And Sewage Market, Segmentation By Operator, Historic And Forecast, 2019 – 2024, 2029F, 2034F, $ Million
    • Figure 143: Brazil Water And Sewage Market, Segmentation By End User, Historic And Forecast, 2019 – 2024, 2029F, 2034F, $ Million
    • Figure 144: Chile Water And Sewage Market, Segmentation By Type, Historic And Forecast, 2019 – 2024, 2029F, 2034F, $ Million
    • Figure 145: Chile Water And Sewage Market, Segmentation By Operator, Historic And Forecast, 2019 – 2024, 2029F, 2034F, $ Million
    • Figure 146: Chile Water And Sewage Market, Segmentation By End User, Historic And Forecast, 2019 – 2024, 2029F, 2034F, $ Million
    • Figure 147: Argentina Water And Sewage Market, Segmentation By Type, Historic And Forecast, 2019 – 2024, 2029F, 2034F, $ Million
    • Figure 148: Argentina Water And Sewage Market, Segmentation By Operator, Historic And Forecast, 2019 – 2024, 2029F, 2034F, $ Million
    • Figure 149: Argentina Water And Sewage Market, Segmentation By End User, Historic And Forecast, 2019 – 2024, 2029F, 2034F, $ Million
    • Figure 150: Colombia Water And Sewage Market, Segmentation By Type, Historic And Forecast, 2019 – 2024, 2029F, 2034F, $ Million
    • Figure 151: Colombia Water And Sewage Market, Segmentation By Operator, Historic And Forecast, 2019 – 2024, 2029F, 2034F, $ Million
    • Figure 152: Colombia Water And Sewage Market, Segmentation By End User, Historic And Forecast, 2019 – 2024, 2029F, 2034F, $ Million
    • Figure 153: Peru Water And Sewage Market, Segmentation By Type, Historic And Forecast, 2019 – 2024, 2029F, 2034F, $ Million
    • Figure 154: Peru Water And Sewage Market, Segmentation By Operator, Historic And Forecast, 2019 – 2024, 2029F, 2034F, $ Million
    • Figure 155: Peru Water And Sewage Market, Segmentation By End User, Historic And Forecast, 2019 – 2024, 2029F, 2034F, $ Million
    • Figure 156: Middle East Water And Sewage Market, Segmentation By Type, Historic And Forecast, 2019 – 2024, 2029F, 2034F, $ Million
    • Figure 157: Middle East Water And Sewage Market, Segmentation By Operator, Historic And Forecast, 2019 – 2024, 2029F, 2034F, $ Million
    • Figure 158: Middle East Water And Sewage Market, Segmentation By End User, Historic And Forecast, 2019 – 2024, 2029F, 2034F, $ Million
    • Figure 159: Saudi Arabia Water And Sewage Market, Segmentation By Type, Historic And Forecast, 2019 – 2024, 2029F, 2034F, $ Million
    • Figure 160: Saudi Arabia Water And Sewage Market, Segmentation By Operator, Historic And Forecast, 2019 – 2024, 2029F, 2034F, $ Million
    • Figure 161: Saudi Arabia Water And Sewage Market, Segmentation By End User, Historic And Forecast, 2019 – 2024, 2029F, 2034F, $ Million
    • Figure 162: Israel Water And Sewage Market, Segmentation By Type, Historic And Forecast, 2019 – 2024, 2029F, 2034F, $ Million
    • Figure 163: Israel Water And Sewage Market, Segmentation By Operator, Historic And Forecast, 2019 – 2024, 2029F, 2034F, $ Million
    • Figure 164: Israel Water And Sewage Market, Segmentation By End User, Historic And Forecast, 2019 – 2024, 2029F, 2034F, $ Million
    • Figure 165: Iran Water And Sewage Market, Segmentation By Type, Historic And Forecast, 2019 – 2024, 2029F, 2034F, $ Million
    • Figure 166: Iran Water And Sewage Market, Segmentation By Operator, Historic And Forecast, 2019 – 2024, 2029F, 2034F, $ Million
    • Figure 167: Iran Water And Sewage Market, Segmentation By End User, Historic And Forecast, 2019 – 2024, 2029F, 2034F, $ Million
    • Figure 168: Turkey Water And Sewage Market, Segmentation By Type, Historic And Forecast, 2019 – 2024, 2029F, 2034F, $ Million
    • Figure 169: Turkey Water And Sewage Market, Segmentation By Operator, Historic And Forecast, 2019 – 2024, 2029F, 2034F, $ Million
    • Figure 170: Turkey Water And Sewage Market, Segmentation By End User, Historic And Forecast, 2019 – 2024, 2029F, 2034F, $ Million
    • Figure 171: United Arab Emirates Water And Sewage Market, Segmentation By Type, Historic And Forecast, 2019 – 2024, 2029F, 2034F, $ Million
    • Figure 172: United Arab Emirates Water And Sewage Market, Segmentation By Operator, Historic And Forecast, 2019 – 2024, 2029F, 2034F, $ Million
    • Figure 173: United Arab Emirates Water And Sewage Market, Segmentation By End User, Historic And Forecast, 2019 – 2024, 2029F, 2034F, $ Million
    • Figure 174: Africa Water And Sewage Market, Segmentation By Type, Historic And Forecast, 2019 – 2024, 2029F, 2034F, $ Million
    • Figure 175: Africa Water And Sewage Market, Segmentation By Operator, Historic And Forecast, 2019 – 2024, 2029F, 2034F, $ Million
    • Figure 176: Africa Water And Sewage Market, Segmentation By End User, Historic And Forecast, 2019 – 2024, 2029F, 2034F, $ Million
    • Figure 177: Egypt Water And Sewage Market, Segmentation By Type, Historic And Forecast, 2019 – 2024, 2029F, 2034F, $ Million
    • Figure 178: Egypt Water And Sewage Market, Segmentation By Operator, Historic And Forecast, 2019 – 2024, 2029F, 2034F, $ Million
    • Figure 179: Egypt Water And Sewage Market, Segmentation By End User, Historic And Forecast, 2019 – 2024, 2029F, 2034F, $ Million
    • Figure 180: Nigeria Water And Sewage Market, Segmentation By Type, Historic And Forecast, 2019 – 2024, 2029F, 2034F, $ Million
    • Figure 181: Nigeria Water And Sewage Market, Segmentation By Operator, Historic And Forecast, 2019 – 2024, 2029F, 2034F, $ Million
    • Figure 182: Nigeria Water And Sewage Market, Segmentation By End User, Historic And Forecast, 2019 – 2024, 2029F, 2034F, $ Million
    • Figure 183: South Africa Water And Sewage Market, Segmentation By Type, Historic And Forecast, 2019 – 2024, 2029F, 2034F, $ Million
    • Figure 184: South Africa Water And Sewage Market, Segmentation By Operator, Historic And Forecast, 2019 – 2024, 2029F, 2034F, $ Million
    • Figure 185: South Africa Water And Sewage Market, Segmentation By End User, Historic And Forecast, 2019 – 2024, 2029F, 2034F, $ Million
    • Figure 186: Global Water And Sewage Market, Key Competitor Estimated Market Shares, 2023, Percentage (%)
    • Figure 187: Veolia Environment SA – Financial Overview, 2019 – 2023, $ Billion
    • Figure 188: American Water Works Company Inc. – Financial Overview, 2019 – 2023, $ Billion
    • Figure 189: Water Corporation – Financial Overview, 2019 – 2023, $ Billion
    • Figure 190: Geographic Regions Covered
    View Report
    View Report
    View Report
    View Report
    View Report
    View Report
    View Report
    Back to top
    Back to top