Contact Us
Electronic Medical Records Global Market Opportunities And Strategies To 2034

Electronic Medical Records Market 2025 – By Type (Acute, Ambulatory, Post-Acute), By Product (Client-Server-Based HER, Web-Based HER), By Mode Of Delivery (Cloud-Based Model, On-Premise Model4 By Business Models (Licensed Software, Technology Resale, Subscriptions, Professional Services, Managed Services, Other Business Models), By Application (E-Prescription, Practice Management, Referral Management, Patient Management, Population Health Management, Other Applications), And By Region, Opportunities And Strategies – Global Forecast To 2035

Electronic Medical Records Global Market Opportunities And Strategies To 2034

Report Price : $4490.00 | Pages : 577 | Published : May 2025 | Delivery Time: Immediately Info icon | Format : pdf icon

Electronic Medical Records Market Definition

Electronic medical records (EMRs) are digital versions of paper-based patient records used by healthcare providers to store, manage and share patient health information. EMRs contain medical history, diagnoses, medications, treatment plans, immunization dates, allergies, radiology images and laboratory test results.

The electronic medical records market consists of sales, by entities (organizations, sole traders, or partnerships), of electronic medical records are primarily used by hospitals, clinics, physician practices and other healthcare facilities to enhance the efficiency and accuracy of patient care. EMRs help healthcare providers track patient data over time, identify patients due for preventive screenings, monitor treatment progress and improve overall healthcare decision-making.

Electronic Medical Records Market Size and growth rate 2025 to 2029: Graph

Electronic Medical Records Market Size

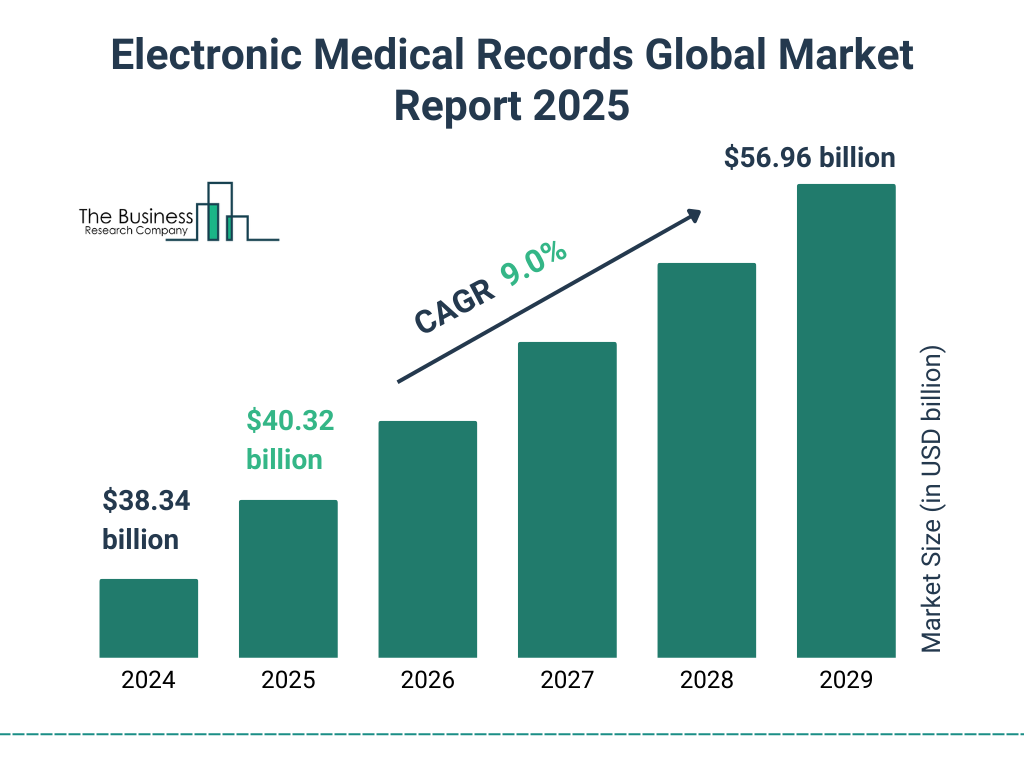
The global electronic medical records market reached a value of nearly $38,338.94 million in 2024, having grown at a compound annual growth rate (CAGR) of 6.83% since 2019. The market is expected to grow from $38,338.94 million in 2024 to $52,275.23 million in 2029 at a rate of 6.40%. The market is then expected to grow at a CAGR of 6.00% from 2029 and reach $69,967.62 million in 2034.

Growth in the historic period resulted from favorable government support, shift toward personalized medicine, growth in healthcare infrastructure and increasing medical tourism. Factors that negatively affected growth in the historic period were the high costs of EMR systems and reluctance to adopt new technology in patients.

Going forward, the increasing prevalence of chronic diseases, rising healthcare spending, expansion of telehealth services and increasing digital transformation in healthcare support will drive growth. Factors that could hinder the growth of the electronic medical records market in the future include were limited availability of skilled professionals and inadequate IT infrastructure.  

Electronic Medical Records Market Drivers

The key drivers of the electronic medical records market include:

Expansion of Telehealth Services

During the forecast period, the expansion of telehealth services will propel the growth of the electronic medical records market. The expansion of telehealth services is poised to significantly propel the growth of the electronic medical records (EMR), as healthcare providers increasingly adopt digital platforms for remote patient care. The need for robust, secure and efficient systems to store, access and share patient data becomes paramount. As more healthcare systems adopt telemedicine, the integration of EMRs becomes crucial for seamless communication and enhanced patient care. For instance, in February 2025, according to Cross River Therapy, a US-based personal care team, the telehealth industry is projected to reach a market value of $194.1 billion by 2023 and $459.8 billion by 2030.  Therefore, the expansion of telehealth services is expected to drive the growth of the electronic medical records market.

Electronic Medical Records Market Restraints

The key restraints on the electronic medical records market include:

Limited Availability Of Skilled Professionals

The limited availability of skilled professionals is expected to hamper the growth of the electronic medical records market during the forecast period. The implementation and management of electronic medical records (EMR) systems require specialized expertise and skilled professionals. However, the ongoing shortage of qualified personnel presents a significant challenge for organizations in recruiting and retaining the necessary talent to effectively operate these complex systems. This lack of skilled professionals can result in slower adoption rates, operational inefficiencies and ultimately impede the growth of the market. For instance, in March 2024, according to the Association of American Medical Colleges, a US-based medication company, by 2036, the United States is projected to experience a shortage of as many as 86,000 physicians.  Therefore, the limited availability of skilled professionals is expected to hinder the growth of the electronic medical records market during the forecast period.

Electronic Medical Records Market Trends

Major trends shaping the electronic medical records market include:

New Health Records Feature Brings Seamless Access To Prescriptions And Lab Results

Leading companies in the electronic medical records market are prioritizing the development of advanced health record features to provide seamless access to prescriptions and lab results. A key innovation is a secure health locker that stores personal health data, ensuring it remains protected and accessible only to the user. This solution adheres to the highest standards of privacy and security, safeguarding sensitive medical information. For instance, in January 2025, Samsung, a South Korea-based consumer electronics corporation, launched the Health Records feature on its Samsung Health app in India, in alignment with the government's Ayushman Bharat Digital Mission (ABDM). This new feature enables users to create and access their Ayushman Bharat Health Account (ABHA) directly within the app, providing a secure platform for managing health data such as prescriptions, lab results and hospital visits, all linked to their ABHA ID. Users can register using their Aadhaar or mobile number and access a secure health locker. Additionally, the feature streamlines outpatient services by allowing users to generate virtual queue tokens through QR code scanning at ABDM-compliant hospitals.

Transforming Clinical Efficiency With Cloud-Based EHR Technology

Companies operating in the electronic medical records market are transforming clinical efficiency with cloud-based electronic health record EHR technology. This cloud-based approach allows seamless access to patient data across different locations and devices. It enhances data interoperability, making it easier for hospitals, clinics and healthcare providers to share information. For instance, in November 2024, Oracle, a US-based computer software company, unveiled its next-generation electronic health record (EHR) system at the Oracle Health Summit. This new EHR is built on Oracle cloud infrastructure and integrates AI capabilities across the clinical workflow to automate processes and enhance care delivery. It features conversational search, voice-driven navigation and AI-supported summaries to streamline physician workflows. The system also includes Oracle Health Data Intelligence, which integrates patient data from multiple sources to provide real-time insights and support personalized care plans.

Opportunities And Recommendations In The Electronic Medical Records Market

Opportunities – The top opportunities in the electronic medical records market segmented by type will arise in the ambulatory segment, which will gain $7,624.10 million of global annual sales by 2029. The top opportunities in the electronic medical records market segmented by product will arise in the web-based EHR segment, which will gain $9,454.20 million of global annual sales by 2029. The top opportunities in the electronic medical records market segmented by mode of delivery will arise in the cloud-based model segment, which will gain $10,225.24 million of global annual sales by 2029. The top opportunities in the electronic medical records market segmented by business models will arise in the subscriptions segment, which will gain $6,488.13 million of global annual sales by 2029. The top opportunities in the electronic medical records market segmented by application will arise in the practice management segment, which will gain $3,636.36 million of global annual sales by 2029. The electronic medical records market size will gain the most in the USA at $4,626.68 million.

Recommendations- To take advantage of the opportunities, The Business Research Company recommends the electronic medical records companies to focus on enhancing secure digital health record access, focus on enhancing clinical efficiency through cloud-based EHR integration, focus on cloud-native EHR platforms for underserved healthcare providers, focus on expanding integrated EMR platforms across healthcare networks, focus on integrating cloud-based features to improve healthcare efficiency, focus on the ambulatory segment to capture high-growth opportunities, expand in emerging markets, continue to focus on developed markets, focus on expanding access through strategic partnerships and localized digital platforms, focus on value-based tiered pricing to maximize adoption across healthcare segments, focus on personalized digital outreach to healthcare providers, focus on strategic partnerships and referral programs and focus on training healthcare staff and supporting clinical workflows.

Electronic Medical Records Market Segmentation

The electronic medical records market is segmented by type, by product, by mode of delivery, by business models and by application.


By Type –


The electronic medical records market is segmented by type into:

    • a) Acute
    • b) Ambulatory
    • c) Post-Acute

The acute market was the largest segment of the electronic medical records market segmented by type, accounting for 45.82% or $17,567.86 million of the total in 2024. Going forward, the ambulatory segment is expected to be the fastest growing segment in the electronic medical records market segmented by type, at a CAGR of 8.63% during 2024-2029.


By Product –


The electronic medical records market is segmented by product into:

    • a) Client-Server-Based EHR
    • b) Web-Based EHR

The client-server-based EHR market was the largest segment of the electronic medical records market segmented by product, accounting for 56.27% or $21,571.48 million of the total in 2024. Going forward, the client-server-based EHR segment is expected to be the fastest growing segment in the electronic medical records market segmented by product, at a CAGR of 7.54% during 2024-2029.


By Mode Of Delivery –


The electronic medical records market is segmented by mode of delivery into:

    • a) Cloud-Based Model
    • b) On-Premise Model

The cloud-based model market was the largest segment of the electronic medical records market segmented by mode of delivery, accounting for 60.28% or $23,110.29 million of the total in 2024. Going forward, the cloud-based model segment is expected to be the fastest growing segment in the electronic medical records market segmented by mode of delivery, at a CAGR of 7.60% during 2024-2029.


By Business Models –


The electronic medical records market is segmented by business models into:

  1. a) Licensed Software
  2. b) Technology Resale
  3. c) Subscriptions
  4. d) Professional Services
  5. e) Managed Services
  6. f) Other Business Models

The licensed software market was the largest segment of the electronic medical records market segmented by business models, accounting for 38.20% or $14,645.47 million of the total in 2024. Going forward, the subscriptions segment is expected to be the fastest growing segment in the electronic medical records market segmented by business models, at a CAGR of 11.00% during 2024-2029.


By Application –


The electronic medical records market is segmented by application into:

  1. a) E-Prescription
  2. b) Practice Management
  3. c) Referral Management
  4. d) Patient Management
  5. e) Population Health Management
  6. f) Other Applications

The practice management market was the largest segment of the electronic medical records market segmented by application, accounting for 27.20% or $10,428.19 million of the total in 2024. Going forward, the e-prescription segment is expected to be the fastest growing segment in the electronic medical records market segmented by application, at a CAGR of 8.12% during 2024-2029.


By Geography - The electronic medical records market is segmented by geography into:

      o Asia Pacific

      • • China
      • • India
      • • Japan
      • • Australia
      • • Indonesia
      • • South Korea

      o North America

      • • USA
      • • Canada

      o South America

      • • Brazil

      o Western Europe

      • • France
      • • Germany
      • • UK
      • • Italy
      • • Spain

      o Eastern Europe

      • • Russia

      o Middle East

      o Africa

North America was the largest region in the electronic medical records market, accounting for 38.61% or $14,802.78 million of the total in 2024. It was followed by Western Europe, Asia-Pacific and then the other regions. Going forward, the fastest-growing regions in the electronic medical records market will be Asia-Pacific and South America where growth will be at CAGRs of 7.99% and 7.92% respectively. These will be followed by Western Europe and Eastern Europe where the markets are expected to grow at CAGRs of 6.34% and 6.29% respectively.

Electronic Medical Records Market Competitive Landscape

Major Competitors are:

  • Epic Systems Corporation
  • Oracle (Cerner Corporation)
  • MEDITECH (Medical Information Technology Inc)
  • CompuGroup Medical SE & Co. KGaA.
  • NextGen Healthcare LLC
  • Other Competitors Include:

  • eClinicalWorks Inc.
  • InterSystems Corporation
  • Philips (Tasy EMR)
  • GE Healthcare
  • Henry Schein Medical Systems Inc.
  • Infomed Vietnam
  • Honeywell Lifesciences
  • Philips Healthcare
  • McKesson Corporation
  • Oracle Health
  • Huawei Technologies Co., Ltd
  • Innovaccer
  • Pharm Easy
  • Practo
  • Mfine
  • Medi Buddy
  • JD Health
  • Chamonix
  • China Mobile Hong Kong Company Limited
  • China Mobile Limited
  • Heals Healthcare
  • Intelligentdx Pvt Ltd
  • Samsung India
  • Wemex Corporation
  • Fujitsu Limited
  • Sapporo Medical University
  • Medical Data Vision Co., Ltd.
  • LG Healthcare
  • Telstra Health Pty Ltd
  • Hyland Software
  • Greenway Health
  • China Medical University Hospital (CMUH)
  • Vascue
  • Ultra High Point Limited
  • Mindray Medical International Limited
  • Medidata Solutions
  • Japan's Mitla Co., Ltd
  • NEC Corporation
  • NTT DATA Group
  • Samsung Medical Center
  • Inha University Hospital
  • Philips Korea
  • Better Doc
  • Biovotion
  • BrainControl
  • Coimbra Genomics
  • Dacadoo
  • Doctoralia
  • Emperra
  • Exovite
  • Healthbank
  • NeurNation
  • Nutrino
  • Px Healthcare
  • SilverCloud
  • Enovacom
  • Medanets Oy
  • Ayesa
  • Chipsoft B.V.
  • CompuGroup Medical
  • 1C Company
  • GE Poland
  • McKesson Europe
  • Honeywell Healthcare
  • Veradigm Inc.
  • AutoCruitment
  • Oracle
  • WELL Health Technologies Corp.
  • MEDFAR Clinical Solutions
  • Biofile
  • HealthPlix
  • Medicon
  • Red Hat
  • Tasy
  • Cerner Corporation
  • Veradigm
  • Wipro Limited
  • Royal Philips
  • CloudPital
  • MedicoPlus
  • Etisalat
  • Clinicea
  • Aster DM Healthcare
  • Burjeel Hospitals
  • Ajir Ltd.
  • MEDITECH South Africa
  • Allgeier
  • Author: Abdul Wasay

    Electronic Medical Records Market Size

    The global electronic medical records market size grew from $22,228.2 million in 2016 to $31,775.2 million in 2021 at a compound annual growth rate (CAGR) of 7.4%. The global electronic medical records market size is expected to grow from $31,775.2 million in 2021 to $44,179.6 million in 2026 at a CAGR of 6.8%, and to $65,936 million in 2031 at a CAGR of 8.3%.

    Growth in the historic period resulted from the growth in healthcare information technology, increased government initiatives, increased demand for digital transformation in healthcare and COVID-19 outbreak.

    Going forward, the technological developments, a surge in the number of health diseases, increasing healthcare expenditure and faster economic growth will drive the market growth. Factors that could hinder the growth of the electronic medical records market in the future include data safety issues and the Russia-Ukraine war.

    Electronic Medical Records Market Drivers

    The key drivers of the electronic medical records market include:

    Surge In The Number Of Health Diseases

    Rising health diseases globally are expected to propel the growth of the electronic medical records market in the forecast period. Health diseases are increasing due to weather changes, rapid urbanization, changing land-use patterns, infections, heredity and other reasons. The increasing prevalence of diseases will lead to an increase in the number of patients, supporting the demand for medical record keeping, including EMRs. Due to the ever-increasing loads of healthcare documents and information, there will be a need for an effective tool for keeping records, making the electronic medical record one of the most effective and efficient tools to store, access, retrieve and protect patient health records, while also helping in preventive care. According to the International Agency for Research on Cancer (IARC), an intergovernmental agency and part of WHO (World Health Organization), the number of new cancer cases is estimated to reach 26 million and of cancer deaths is projected to reach 17 million per year by 2030.  Therefore, the rising number of health diseases will fuel the growth of the electronic medical records market.

    Electronic Medical Records Market Restraints

    The key restraints on the electronic medical records market include:

    Data Safety Issues

    The data safety issues and challenges with respect to EMRs are expected to hamper the growth of the electronic medical records market during the forecast period. Electronic medical records are associated with several privacy and security issues, such as patients’ data and safety. Moreover, cybercrime is increasing globally, which poses a significant challenge to electronic medical records. Cybercrime is rising due to the increasing automation, rapid use of the internet, remote working and others. The vulnerability of electronic records over the internet will increase the risks associated with the use of electronic medical records. For example, according to Cybersecurity Ventures, a global publisher covering the global cyber economy, by 2025, cybercrime is expected to cost the world $10.5 trillion annually. Therefore, the data safety issues of EMRs are expected to hinder the growth of the electronic medical records market during the forecast period.

    Electronic Medical Records Market Trends

    Major trends influencing the electronic medical records market include:

    Use Of Artificial Intelligence

    Artificial intelligence (AI) is gaining traction in the electronic medical records market. Artificial intelligence is widely used in EHRs (Electronic Health Records) to enhance data search, extraction and individualized treatment recommendations. For example, in August 2022, TidalHealth, a Maryland, US-based health system of hospitals, health campuses, physician and specialty offices, collaborated with Regard, a Los Angeles, US-based software company, to launch AI-based software to increase patient diagnostic accuracy, lessen physician exhaustion and boost revenue. The software employs AI to assist doctors in making a medical diagnosis and assists practitioners in streamlining EHR chart checks and improving patient safety.

    Adoption Of Natural Language Processing

    The adoption of Natural Language Processing (NLP) is a key trend in the electronic medical records market. NLP creates machines that can comprehend text or voice input and react to it as people do by responding with text or speech of their own. NLP techniques are used in EHRs to capture unstructured data, analyze the grammatical structure, determine the meaning and summarize the data. As a result, NLP approaches can cut costs, while thoroughly extracting large amounts of data analytics information. For instance, in September 2022, Edifecs, Inc., a US-based healthcare technology company, launched a technology that completely automates prior authorization at the point of care, resulting in better member experiences, improved results, continuous compliance and less administrative work. The automated prior permission solution from Edifecs interacts with EHRs and instantaneously provides authorization using NLP and AI.

    Opportunities And Recommendations In The Electronic Medical Records Market

    Opportunities –The top opportunities in the electronic medical records market by type will arise in the acute segment, which will gain $5,706.8 million of global annual sales by 2026. The top opportunities in the electronic medical records market by product will arise in the web-based EHR segment, which will gain $7,516.8 million of global annual sales by 2026. The top opportunities in the electronic medical records market by mode of delivery will arise in the cloud-based model segment, which will gain $10,141.6 million of global annual sales by 2026. The top opportunities in the electronic medical records market by business models will arise in the professional services segment, which will gain $5,335.3 million of global annual sales by 2026. The top opportunities in the electronic medical records market by application will arise in the practice management segment, which will gain $3,521.8 million of global annual sales by 2026. The electronic medical records market size will gain the most in the USA at $4,139.9 million.

    Recommendations-To take advantage of the opportunities, The Business Research Company recommends the companies in the electronic medical records market to focus on use of artificial intelligence, focus on natural language processing, focus on cloud-based EHRs (electronic health records), focus on voice assistance, expand in emerging markets, continue to focus on developed markets, focus on strategic partnerships, offer competitive pricing, participate in trade shows and events and continue to target fast-growing applications.

    Electronic Medical Records Market Segmentation

    The electronic medical records market is also segmented by type, by product, by mode of delivery, by business models, and by application.
    By Type-
    The electronic medical records market is segmented by type into
      • a) Acute
      • b) Ambulatory
      • c) Post-Acute
    The acute market was the largest segment of the electronic medical records market segmented by type, accounting for 47.8% of the total in 2021. Going forward, the ambulatory market is expected to be the fastest growing segment in the electronic medical records market segmented by type, at a CAGR of 7.2% during 2021-2026.
    By Product-
    The electronic medical records market is segmented by product into
      • a) Client-Server-Based HER
      • b) Web-Based HER
    The web-based EHR market was the largest segment of the electronic medical records market segmented by product, accounting for 55.2% of the total in 2021. Going forward, the web-based EHR market is expected to be the fastest growing segment in the electronic medical records market segmented by product, at a CAGR of 7.4% during 2021-2026.
    By Mode Of Delivery-
    The electronic medical records market is segmented by mode of delivery into
      • a) Cloud-Based Model
      • b) On-Premise Model
    The cloud-based model market was the largest segment of the electronic medical records market segmented by mode of delivery, accounting for 70.3% of the total in 2021. Going forward, the cloud-based model market is expected to be the fastest growing segment in the electronic medical records market segmented by mode of delivery, at a CAGR of 7.8% during 2021-2026.
    By Business Models-
    The electronic medical records market is segmented by business models into
      • a) Licensed Software
      • b) Technology Resale
      • c) Subscriptions
      • d) Professional Services
      • e) Managed Services
      • f) Other Business Models
    The professional services market was the largest segment of the electronic medical records market segmented by business models, accounting for 35.8% of the total in 2021. Going forward, the professional services market is expected to be the fastest growing segment in the electronic medical records market segmented by business models, at a CAGR of 8.0% during 2021-2026.
    By Application
    The electronic medical records market is segmented by application into
      • a) E-Prescription
      • b) Practice Management
      • c) Referral Management
      • d) Patient Management
      • e) Population Health Management
      • f) Other Applications
    The practice management market was the largest segment of the electronic medical records market segmented by application, accounting for 30.3% of the total in 2021. Going forward, the e-prescription market is expected to be the fastest growing segment in the electronic medical records market segmented by application, at a CAGR of 8.0% during 2021-2026.
    By Geography - The electronic medical records market is segmented by geography into
        o Asia Pacific
        • • China
        • • India
        • • Japan
        • • Australia
        • • Indonesia
        • • South Korea
        o North America
        • • USA
        o South America
        • • Brazil
        o Western Europe
        • • France
        • • Germany
        • • UK
        o Eastern Europe
        • • Russia
        o Middle East
        o Africa
    North America was the largest region in the electronic medical records market, accounting for 39.1% of the total in 2022. It was followed by Western Europe, and then the other regions. Going forward, the fastest-growing regions in the electronic medical records market will be Asia Pacific and South America, where growth will be at CAGRs of 8.4% and 8.4% respectively. These will be followed by the Middle East and Western Europe, where the markets are expected to grow at CAGRs of 7.1% and 6.9% respectively.

    Electronic Medical Records Market Competitive Landscape

    Major Competitors are:

  • Cerner Corporation
  • Allscripts Healthcare Solutions, Inc
  • General Electric Company
  • Athenahealth
  • NextGen Healthcare, Inc
  • Other Competitors Include:

  • Epic Systems Corp
  • eClinicalWorks
  • CPSI
  • Intersystems Corporation
  • AdvancedMD, Inc
  • Innovaccer
  • Pharm Easy
  • 1mg
  • Practo
  • Mfine
  • Medi Buddy
  • Indegene
  • Ping A Good Doctor
  • JD Health
  • CISCO Systems Inc
  • GE Healthcare
  • Honeywell Lifesciences
  • Philips Healthcare
  • Better Doc
  • Biovotion
  • BrainControl
  • Coimbra Genomics
  • Dacadoo
  • Doctoralia
  • Emperra
  • Exovite
  • Genexyx
  • Giraff
  • Healthbank
  • NeurNation
  • Nutrino
  • Psious
  • Px Healthcare
  • SilverCloud
  • Systems Healthcare Solutions
  • TrialReach
  • XtremeVRI
  • TietoEVRY
  • DOC+
  • McKesson Corporation
  • Medical Information Technology, Inc
  • Health Information Management Systems
  • Computer Programs and Systems, Inc CPSI
  • CureMD Healthcare
  • Greenway Health,LLC
  • WELL Health Technologies Corp
  • Indivica Inc
  • OSCARwest
  • MV Sistemas
  • Philips-Tasy
  • Siemens
  • R.R. Information Systems and Technologies Ltd
  • Mubadala Health
  • G42 Healthcare
  • Etisalat
  • Vezeeta
  • OKADOC
  • Doxy.me
  • Safermom
  • Mobicure
  • Ubenwa
  • Medsaf
  • GenRx
  • MDaaS Global
  • Kangpe
  • Hudibia
  • Lifebank
  • Redbank
  • AMD Global Telemedicine Inc
  • Medtronic PLC
  • List Of Tables

      Table 1: Global Electronic Medical Records Market, Historic, 2019 – 2024, $ Million
    • Table 2: Global Electronic Medical Records Market, Forecast, 2024 – 2029, 2034F, $ Million
    • Table 3: Global Electronic Medical Records Market TAM, 2024 And 2034, $ Million
    • Table 4: Global Electronic Medical Records Market, Segmentation By Type, Historic And Forecast, 2019 – 2024, 2029F, 2034F, $ Million
    • Table 5: Global Electronic Medical Records Market, Segmentation By Product, Historic And Forecast, 2019 – 2024, 2029F, 2034F, $ Million
    • Table 6: Global Electronic Medical Records Market, Segmentation By Mode Of Delivery, Historic And Forecast, 2019 – 2024, 2029F, 2034F, $ Million
    • Table 7: Global Electronic Medical Records Market, Segmentation By Business Models, Historic And Forecast, 2019 – 2024, 2029F, 2034F, $ Million
    • Table 8: Global Electronic Medical Records Market, Segmentation By Application, Historic And Forecast, 2019 – 2024, 2029F, 2034F, $ Million
    • Table 9: Global Electronic Medical Records Market, Sub-Segmentation Of Acute, By Type, Historic And Forecast, 2019 – 2024, 2029F, 2034F, $ Million
    • Table 10: Global Electronic Medical Records Market, Sub-Segmentation By Ambulatory, By Type, Historic And Forecast, 2019 – 2024, 2029F, 2034F, $ Million
    • Table 11: Global Electronic Medical Records Market, Sub-Segmentation By Post-Acute, By Type, Historic And Forecast, 2019 – 2024, 2029F, 2034F, $ Million
    • Table 12: Global Electronic Medical Records Market, By Region, Historic and Forecast, 2019 – 2024, 2029F, 2034F, $ Million
    • Table 13: Global Electronic Medical Records Market, By Country, Historic and Forecast, 2019 – 2024, 2029F, 2034F, $ Million
    • Table 14: Adoption Rate (%) Of Electronic Medical Records, By Country, 2024
    • Table 15: Asia-Pacific GDP Per Capita, By Country, 2019-2024, $
    • Table 16:  Asia-Pacific Population, By Country, 2019-2029, Millions
    • Table 17: Asia-Pacific Electronic Medical Records Market, Segmentation By Type, Historic And Forecast, 2019 – 2024, 2029F, 2034F, $ Million
    • Table 18: Asia-Pacific Electronic Medical Records Market, Segmentation By Product, Historic And Forecast, 2019 – 2024, 2029F, 2034F, $ Million
    • Table 19: Asia-Pacific Electronic Medical Records Market, Segmentation By Mode Of Delivery, Historic And Forecast, 2019 – 2024, 2029F, 2034F, $ Million
    • Table 20: China GDP Per Capita, 2019-2024, $
    • Table 21:  China Population, 2019-2029, Millions
    • Table 22: China Electronic Medical Records Market, Segmentation By Type, Historic And Forecast, 2019 – 2024, 2029F, 2034F, $ Million
    • Table 23: China Electronic Medical Records Market, Segmentation By Product, Historic And Forecast, 2019 – 2024, 2029F, 2034F, $ Million
    • Table 24: China Electronic Medical Records Market, Segmentation By Mode Of Delivery, Historic And Forecast, 2019 – 2024, 2029F, 2034F, $ Million
    • Table 25: India Electronic Medical Records Market, Segmentation By Type, Historic And Forecast, 2019 – 2024, 2029F, 2034F, $ Million
    • Table 26: India Electronic Medical Records Market, Segmentation By Product, Historic And Forecast, 2019 – 2024, 2029F, 2034F, $ Million
    • Table 27: India Electronic Medical Records Market, Segmentation By Mode Of Delivery, Historic And Forecast, 2019 – 2024, 2029F, 2034F, $ Million
    • Table 28: Japan GDP Per Capita, 2019-2024, $
    • Table 29:  Japan Population, By Country, 2019-2029, Millions
    • Table 30: Japan Electronic Medical Records Market, Segmentation By Type, Historic And Forecast, 2019 – 2024, 2029F, 2034F, $ Million
    • Table 31: Japan Electronic Medical Records Market, Segmentation By Product, Historic And Forecast, 2019 – 2024, 2029F, 2034F, $ Million
    • Table 32: Japan Electronic Medical Records Market, Segmentation By Mode Of Delivery, Historic And Forecast, 2019 – 2024, 2029F, 2034F, $ Million
    • Table 33: Australia Electronic Medical Records Market, Segmentation By Type, Historic And Forecast, 2019 – 2024, 2029F, 2034F, $ Million
    • Table 34: Australia Electronic Medical Records Market, Segmentation By Product, Historic And Forecast, 2019 – 2024, 2029F, 2034F, $ Million
    • Table 35: Australia Electronic Medical Records Market, Segmentation By Mode Of Delivery, Historic And Forecast, 2019 – 2024, 2029F, 2034F, $ Million
    • Table 36: Indonesia Electronic Medical Records Market, Segmentation By Type, Historic And Forecast, 2019 – 2024, 2029F, 2034F, $ Million
    • Table 37: Indonesia Electronic Medical Records Market, Segmentation By Product, Historic And Forecast, 2019 – 2024, 2029F, 2034F, $ Million
    • Table 38: Indonesia Electronic Medical Records Market, Segmentation By Mode Of Delivery, Historic And Forecast, 2019 – 2024, 2029F, 2034F, $ Million
    • Table 39: South Korea GDP Per Capita, 2019-2024, $
    • Table 40:  South Korea Population, 2019-2029, Millions
    • Table 41: South Korea Electronic Medical Records Market, Segmentation By Type, Historic And Forecast, 2019 – 2024, 2029F, 2034F, $ Million
    • Table 42: South Korea Electronic Medical Records Market, Segmentation By Product, Historic And Forecast, 2019 – 2024, 2029F, 2034F, $ Million
    • Table 43: South Korea Electronic Medical Records Market, Segmentation By Mode Of Delivery, Historic And Forecast, 2019 – 2024, 2029F, 2034F, $ Million
    • Table 44: Bangladesh Electronic Medical Records Market, Segmentation By Type, Historic And Forecast, 2019 – 2024, 2029F, 2034F, $ Million
    • Table 45: Bangladesh Electronic Medical Records Market, Segmentation By Product, Historic And Forecast, 2019 – 2024, 2029F, 2034F, $ Million
    • Table 46: Bangladesh Electronic Medical Records Market, Segmentation By Mode Of Delivery, Historic And Forecast, 2019 – 2024, 2029F, 2034F, $ Million
    • Table 47: Thailand Electronic Medical Records Market, Segmentation By Type, Historic And Forecast, 2019 – 2024, 2029F, 2034F, $ Million
    • Table 48: Thailand Electronic Medical Records Market, Segmentation By Product, Historic And Forecast, 2019 – 2024, 2029F, 2034F, $ Million
    • Table 49: Thailand Electronic Medical Records Market, Segmentation By Mode Of Delivery, Historic And Forecast, 2019 – 2024, 2029F, 2034F, $ Million
    • Table 50: Vietnam Electronic Medical Records Market, Segmentation By Type, Historic And Forecast, 2019 – 2024, 2029F, 2034F, $ Million
    • Table 51: Vietnam Electronic Medical Records Market, Segmentation By Product, Historic And Forecast, 2019 – 2024, 2029F, 2034F, $ Million
    • Table 52: Vietnam Electronic Medical Records Market, Segmentation By Mode Of Delivery, Historic And Forecast, 2019 – 2024, 2029F, 2034F, $ Million
    • Table 53: Malaysia Electronic Medical Records Market, Segmentation By Type, Historic And Forecast, 2019 – 2024, 2029F, 2034F, $ Million
    • Table 54: Malaysia Electronic Medical Records Market, Segmentation By Product, Historic And Forecast, 2019 – 2024, 2029F, 2034F, $ Million
    • Table 55: Malaysia Electronic Medical Records Market, Segmentation By Mode Of Delivery, Historic And Forecast, 2019 – 2024, 2029F, 2034F, $ Million
    • Table 56: Singapore Electronic Medical Records Market, Segmentation By Type, Historic And Forecast, 2019 – 2024, 2029F, 2034F, $ Million
    • Table 57: Singapore Electronic Medical Records Market, Segmentation By Product, Historic And Forecast, 2019 – 2024, 2029F, 2034F, $ Million
    • Table 58: Singapore Electronic Medical Records Market, Segmentation By Mode Of Delivery, Historic And Forecast, 2019 – 2024, 2029F, 2034F, $ Million
    • Table 59: Philippines Electronic Medical Records Market, Segmentation By Type, Historic And Forecast, 2019 – 2024, 2029F, 2034F, $ Million
    • Table 60: Philippines Electronic Medical Records Market, Segmentation By Product, Historic And Forecast, 2019 – 2024, 2029F, 2034F, $ Million
    • Table 61: Philippines Electronic Medical Records Market, Segmentation By Mode Of Delivery, Historic And Forecast, 2019 – 2024, 2029F, 2034F, $ Million
    • Table 62: Hong Kong Electronic Medical Records Market, Segmentation By Type, Historic And Forecast, 2019 – 2024, 2029F, 2034F, $ Million
    • Table 63: Hong Kong Electronic Medical Records Market, Segmentation By Product, Historic And Forecast, 2019 – 2024, 2029F, 2034F, $ Million
    • Table 64: Hong Kong Electronic Medical Records Market, Segmentation By Mode Of Delivery, Historic And Forecast, 2019 – 2024, 2029F, 2034F, $ Million
    • Table 65: New Zealand Electronic Medical Records Market, Segmentation By Type, Historic And Forecast, 2019 – 2024, 2029F, 2034F, $ Million
    • Table 66: New Zealand Electronic Medical Records Market, Segmentation By Product, Historic And Forecast, 2019 – 2024, 2029F, 2034F, $ Million
    • Table 67: New Zealand Electronic Medical Records Market, Segmentation By Mode Of Delivery, Historic And Forecast, 2019 – 2024, 2029F, 2034F, $ Million
    • Table 68: Western Europe GDP Per Capita, By Country, 2019-2024, $
    • Table 69:  Western Europe Population, By Country, 2019-2029, Millions
    • Table 70: Western Europe Electronic Medical Records Market, Segmentation By Type, Historic And Forecast, 2019 – 2024, 2029F, 2034F, $ Million
    • Table 71: Western Europe Electronic Medical Records Market, Segmentation By Product, Historic And Forecast, 2019 – 2024, 2029F, 2034F, $ Million
    • Table 72: Western Europe Electronic Medical Records Market, Segmentation By Mode Of Delivery, Historic And Forecast, 2019 – 2024, 2029F, 2034F, $ Million
    • Table 73: UK Electronic Medical Records Market, Segmentation By Type, Historic And Forecast, 2019 – 2024, 2029F, 2034F, $ Million
    • Table 74: UK Electronic Medical Records Market, Segmentation By Product, Historic And Forecast, 2019 – 2024, 2029F, 2034F, $ Million
    • Table 75: UK Electronic Medical Records Market, Segmentation By Mode Of Delivery, Historic And Forecast, 2019 – 2024, 2029F, 2034F, $ Million
    • Table 76: Germany Electronic Medical Records Market, Segmentation By Type, Historic And Forecast, 2019 – 2024, 2029F, 2034F, $ Million
    • Table 77: Germany Electronic Medical Records Market, Segmentation By Product, Historic And Forecast, 2019 – 2024, 2029F, 2034F, $ Million
    • Table 78: Germany Electronic Medical Records Market, Segmentation By Mode Of Delivery, Historic And Forecast, 2019 – 2024, 2029F, 2034F, $ Million
    • Table 79: France Electronic Medical Records Market, Segmentation By Type, Historic And Forecast, 2019 – 2024, 2029F, 2034F, $ Million
    • Table 80: France Electronic Medical Records Market, Segmentation By Product, Historic And Forecast, 2019 – 2024, 2029F, 2034F, $ Million
    • Table 81: France Electronic Medical Records Market, Segmentation By Mode Of Delivery, Historic And Forecast, 2019 – 2024, 2029F, 2034F, $ Million
    • Table 82: Italy Electronic Medical Records Market, Segmentation By Type, Historic And Forecast, 2019 – 2024, 2029F, 2034F, $ Million
    • Table 83: Italy Electronic Medical Records Market, Segmentation By Product, Historic And Forecast, 2019 – 2024, 2029F, 2034F, $ Million
    • Table 84: Italy Electronic Medical Records Market, Segmentation By Mode Of Delivery, Historic And Forecast, 2019 – 2024, 2029F, 2034F, $ Million
    • Table 85: Spain Electronic Medical Records Market, Segmentation By Type, Historic And Forecast, 2019 – 2024, 2029F, 2034F, $ Million
    • Table 86: Spain Electronic Medical Records Market, Segmentation By Product, Historic And Forecast, 2019 – 2024, 2029F, 2034F, $ Million
    • Table 87: Spain Electronic Medical Records Market, Segmentation By Mode Of Delivery, Historic And Forecast, 2019 – 2024, 2029F, 2034F, $ Million
    • Table 88: Austria Electronic Medical Records Market, Segmentation By Type, Historic And Forecast, 2019 – 2024, 2029F, 2034F, $ Million
    • Table 89: Austria Electronic Medical Records Market, Segmentation By Product, Historic And Forecast, 2019 – 2024, 2029F, 2034F, $ Million
    • Table 90: Austria Electronic Medical Records Market, Segmentation By Mode Of Delivery, Historic And Forecast, 2019 – 2024, 2029F, 2034F, $ Million
    • Table 91: Belgium Electronic Medical Records Market, Segmentation By Type, Historic And Forecast, 2019 – 2024, 2029F, 2034F, $ Million
    • Table 92: Belgium Electronic Medical Records Market, Segmentation By Product, Historic And Forecast, 2019 – 2024, 2029F, 2034F, $ Million
    • Table 93: Belgium Electronic Medical Records Market, Segmentation By Mode Of Delivery, Historic And Forecast, 2019 – 2024, 2029F, 2034F, $ Million
    • Table 94: Denmark Electronic Medical Records Market, Segmentation By Type, Historic And Forecast, 2019 – 2024, 2029F, 2034F, $ Million
    • Table 95: Denmark Electronic Medical Records Market, Segmentation By Product, Historic And Forecast, 2019 – 2024, 2029F, 2034F, $ Million
    • Table 96: Denmark Electronic Medical Records Market, Segmentation By Mode Of Delivery, Historic And Forecast, 2019 – 2024, 2029F, 2034F, $ Million
    • Table 97: Finland Electronic Medical Records Market, Segmentation By Type, Historic And Forecast, 2019 – 2024, 2029F, 2034F, $ Million
    • Table 98: Finland Electronic Medical Records Market, Segmentation By Product, Historic And Forecast, 2019 – 2024, 2029F, 2034F, $ Million
    • Table 99: Finland Electronic Medical Records Market, Segmentation By Mode Of Delivery, Historic And Forecast, 2019 – 2024, 2029F, 2034F, $ Million
    • Table 100: Ireland Electronic Medical Records Market, Segmentation By Type, Historic And Forecast, 2019 – 2024, 2029F, 2034F, $ Million
    • Table 101: Ireland Electronic Medical Records Market, Segmentation By Product, Historic And Forecast, 2019 – 2024, 2029F, 2034F, $ Million
    • Table 102: Ireland Electronic Medical Records Market, Segmentation By Mode Of Delivery, Historic And Forecast, 2019 – 2024, 2029F, 2034F, $ Million
    • Table 103: Netherlands Electronic Medical Records Market, Segmentation By Type, Historic And Forecast, 2019 – 2024, 2029F, 2034F, $ Million
    • Table 104: Netherlands Electronic Medical Records Market, Segmentation By Product, Historic And Forecast, 2019 – 2024, 2029F, 2034F, $ Million
    • Table 105: Netherlands Electronic Medical Records Market, Segmentation By Mode Of Delivery, Historic And Forecast, 2019 – 2024, 2029F, 2034F, $ Million
    • Table 106: Norway Electronic Medical Records Market, Segmentation By Type, Historic And Forecast, 2019 – 2024, 2029F, 2034F, $ Million
    • Table 107: Norway Electronic Medical Records Market, Segmentation By Product, Historic And Forecast, 2019 – 2024, 2029F, 2034F, $ Million
    • Table 108: Norway Electronic Medical Records Market, Segmentation By Mode Of Delivery, Historic And Forecast, 2019 – 2024, 2029F, 2034F, $ Million
    • Table 109: Portugal Electronic Medical Records Market, Segmentation By Type, Historic And Forecast, 2019 – 2024, 2029F, 2034F, $ Million
    • Table 110: Portugal Electronic Medical Records Market, Segmentation By Product, Historic And Forecast, 2019 – 2024, 2029F, 2034F, $ Million
    • Table 111: Portugal Electronic Medical Records Market, Segmentation By Mode Of Delivery, Historic And Forecast, 2019 – 2024, 2029F, 2034F, $ Million
    • Table 112: Sweden Electronic Medical Records Market, Segmentation By Type, Historic And Forecast, 2019 – 2024, 2029F, 2034F, $ Million
    • Table 113: Sweden Electronic Medical Records Market, Segmentation By Product, Historic And Forecast, 2019 – 2024, 2029F, 2034F, $ Million
    • Table 114: Sweden Electronic Medical Records Market, Segmentation By Mode Of Delivery, Historic And Forecast, 2019 – 2024, 2029F, 2034F, $ Million
    • Table 115: Switzerland Electronic Medical Records Market, Segmentation By Type, Historic And Forecast, 2019 – 2024, 2029F, 2034F, $ Million
    • Table 116: Switzerland Electronic Medical Records Market, Segmentation By Product, Historic And Forecast, 2019 – 2024, 2029F, 2034F, $ Million
    • Table 117: Switzerland Electronic Medical Records Market, Segmentation By Mode Of Delivery, Historic And Forecast, 2019 – 2024, 2029F, 2034F, $ Million
    • Table 118: Eastern Europe GDP Per Capita, By Country, 2019-2024, $
    • Table 119:  Eastern Europe Population, By Country, 2019-2029, Millions
    • Table 120: Eastern Europe Electronic Medical Records Market, Segmentation By Type, Historic And Forecast, 2019 – 2024, 2029F, 2034F, $ Million
    • Table 121: Eastern Europe Electronic Medical Records Market, Segmentation By Product, Historic And Forecast, 2019 – 2024, 2029F, 2034F, $ Million
    • Table 122: Eastern Europe Electronic Medical Records Market, Segmentation By Mode Of Delivery, Historic And Forecast, 2019 – 2024, 2029F, 2034F, $ Million
    • Table 123: Russia Electronic Medical Records Market, Segmentation By Type, Historic And Forecast, 2019 – 2024, 2029F, 2034F, $ Million
    • Table 124: Russia Electronic Medical Records Market, Segmentation By Product, Historic And Forecast, 2019 – 2024, 2029F, 2034F, $ Million
    • Table 125: Russia Electronic Medical Records Market, Segmentation By Mode Of Delivery, Historic And Forecast, 2019 – 2024, 2029F, 2034F, $ Million
    • Table 126: Czech Republic Electronic Medical Records Market, Segmentation By Type, Historic And Forecast, 2019 – 2024, 2029F, 2034F, $ Million
    • Table 127: Czech Republic Electronic Medical Records Market, Segmentation By Product, Historic And Forecast, 2019 – 2024, 2029F, 2034F, $ Million
    • Table 128: Czech Republic Electronic Medical Records Market, Segmentation By Mode Of Delivery, Historic And Forecast, 2019 – 2024, 2029F, 2034F, $ Million
    • Table 129: Poland Electronic Medical Records Market, Segmentation By Type, Historic And Forecast, 2019 – 2024, 2029F, 2034F, $ Million
    • Table 130: Poland Electronic Medical Records Market, Segmentation By Product, Historic And Forecast, 2019 – 2024, 2029F, 2034F, $ Million
    • Table 131: Poland Electronic Medical Records Market, Segmentation By Mode Of Delivery, Historic And Forecast, 2019 – 2024, 2029F, 2034F, $ Million
    • Table 132: Romania Electronic Medical Records Market, Segmentation By Type, Historic And Forecast, 2019 – 2024, 2029F, 2034F, $ Million
    • Table 133: Romania Electronic Medical Records Market, Segmentation By Product, Historic And Forecast, 2019 – 2024, 2029F, 2034F, $ Million
    • Table 134: Romania Electronic Medical Records Market, Segmentation By Mode Of Delivery, Historic And Forecast, 2019 – 2024, 2029F, 2034F, $ Million
    • Table 135: Ukraine Electronic Medical Records Market, Segmentation By Type, Historic And Forecast, 2019 – 2024, 2029F, 2034F, $ Million
    • Table 136: Ukraine Electronic Medical Records Market, Segmentation By Product, Historic And Forecast, 2019 – 2024, 2029F, 2034F, $ Million
    • Table 137: Ukraine Electronic Medical Records Market, Segmentation By Mode Of Delivery, Historic And Forecast, 2019 – 2024, 2029F, 2034F, $ Million
    • Table 138: North America GDP Per Capita, By Country, 2019-2024, $
    • Table 139:  North America Population, By Country, 2019-2029, Millions
    • Table 140: North America Electronic Medical Records Market, Segmentation By Type, Historic And Forecast, 2019 – 2024, 2029F, 2034F, $ Million
    • Table 141: North America Electronic Medical Records Market, Segmentation By Product, Historic And Forecast, 2019 – 2024, 2029F, 2034F, $ Million
    • Table 142: North America Electronic Medical Records Market, Segmentation By Mode Of Delivery, Historic And Forecast, 2019 – 2024, 2029F, 2034F, $ Million
    • Table 143: USA GDP Per Capita, 2019-2024, $
    • Table 144:  USA Population, 2019-2029, Millions
    • Table 145: USA Electronic Medical Records Market, Segmentation By Type, Historic And Forecast, 2019 – 2024, 2029F, 2034F, $ Million
    • Table 146: USA Electronic Medical Records Market, Segmentation By Product, Historic And Forecast, 2019 – 2024, 2029F, 2034F, $ Million
    • Table 147: USA Electronic Medical Records Market, Segmentation By Mode Of Delivery, Historic And Forecast, 2019 – 2024, 2029F, 2034F, $ Million
    • Table 148: Canada GDP Per Capita, 2019-2024, $
    • Table 149:  Canada Population, By Country, 2019-2029, Millions
    • Table 150: Canada Electronic Medical Records Market, Segmentation By Type, Historic And Forecast, 2019 – 2024, 2029F, 2034F, $ Million
    • Table 151: Canada Electronic Medical Records Market, Segmentation By Product, Historic And Forecast, 2019 – 2024, 2029F, 2034F, $ Million
    • Table 152: Canada Electronic Medical Records Market, Segmentation By Mode Of Delivery, Historic And Forecast, 2019 – 2024, 2029F, 2034F, $ Million
    • Table 153: Mexico Electronic Medical Records Market, Segmentation By Type, Historic And Forecast, 2019 – 2024, 2029F, 2034F, $ Million
    • Table 154: Mexico Electronic Medical Records Market, Segmentation By Product, Historic And Forecast, 2019 – 2024, 2029F, 2034F, $ Million
    • Table 155: Mexico Electronic Medical Records Market, Segmentation By Mode Of Delivery, Historic And Forecast, 2019 – 2024, 2029F, 2034F, $ Million
    • Table 156: South America GDP Per Capita, By Country, 2019-2024, $
    • Table 157:  South America Population, By Country, 2019-2029, Millions
    • Table 158: South America Electronic Medical Records Market, Segmentation By Type, Historic And Forecast, 2019 – 2024, 2029F, 2034F, $ Million
    • Table 159: South America Electronic Medical Records Market, Segmentation By Product, Historic And Forecast, 2019 – 2024, 2029F, 2034F, $ Million
    • Table 160: South America Electronic Medical Records Market, Segmentation By Mode Of Delivery, Historic And Forecast, 2019 – 2024, 2029F, 2034F, $ Million
    • Table 161: Brazil Electronic Medical Records Market, Segmentation By Type, Historic And Forecast, 2019 – 2024, 2029F, 2034F, $ Million
    • Table 162: Brazil Electronic Medical Records Market, Segmentation By Product, Historic And Forecast, 2019 – 2024, 2029F, 2034F, $ Million
    • Table 163: Brazil Electronic Medical Records Market, Segmentation By Mode Of Delivery, Historic And Forecast, 2019 – 2024, 2029F, 2034F, $ Million
    • Table 164: Chile Electronic Medical Records Market, Segmentation By Type, Historic And Forecast, 2019 – 2024, 2029F, 2034F, $ Million
    • Table 165: Chile Electronic Medical Records Market, Segmentation By Product, Historic And Forecast, 2019 – 2024, 2029F, 2034F, $ Million
    • Table 166: Chile Electronic Medical Records Market, Segmentation By Mode Of Delivery, Historic And Forecast, 2019 – 2024, 2029F, 2034F, $ Million
    • Table 167: Argentina Electronic Medical Records Market, Segmentation By Type, Historic And Forecast, 2019 – 2024, 2029F, 2034F, $ Million
    • Table 168: Argentina Electronic Medical Records Market, Segmentation By Product, Historic And Forecast, 2019 – 2024, 2029F, 2034F, $ Million
    • Table 169: Argentina Electronic Medical Records Market, Segmentation By Mode Of Delivery, Historic And Forecast, 2019 – 2024, 2029F, 2034F, $ Million
    • Table 170: Colombia Electronic Medical Records Market, Segmentation By Type, Historic And Forecast, 2019 – 2024, 2029F, 2034F, $ Million
    • Table 171: Colombia Electronic Medical Records Market, Segmentation By Product, Historic And Forecast, 2019 – 2024, 2029F, 2034F, $ Million
    • Table 172: Colombia Electronic Medical Records Market, Segmentation By Mode Of Delivery, Historic And Forecast, 2019 – 2024, 2029F, 2034F, $ Million
    • Table 173: Peru Electronic Medical Records Market, Segmentation By Type, Historic And Forecast, 2019 – 2024, 2029F, 2034F, $ Million
    • Table 174: Peru Electronic Medical Records Market, Segmentation By Product, Historic And Forecast, 2019 – 2024, 2029F, 2034F, $ Million
    • Table 175: Peru Electronic Medical Records Market, Segmentation By Mode Of Delivery, Historic And Forecast, 2019 – 2024, 2029F, 2034F, $ Million
    • Table 176: Middle East GDP Per Capita, By Country, 2019-2024, $
    • Table 177:  Middle East Population, By Country, 2019-2029, Millions
    • Table 178: Middle East Electronic Medical Records Market, Segmentation By Type, Historic And Forecast, 2019 – 2024, 2029F, 2034F, $ Million
    • Table 179: Middle East Electronic Medical Records Market, Segmentation By Product, Historic And Forecast, 2019 – 2024, 2029F, 2034F, $ Million
    • Table 180: Middle East Electronic Medical Records Market, Segmentation By Mode Of Delivery, Historic And Forecast, 2019 – 2024, 2029F, 2034F, $ Million
    • Table 181: Saudi Arabia Electronic Medical Records Market, Segmentation By Type, Historic And Forecast, 2019 – 2024, 2029F, 2034F, $ Million
    • Table 182: Saudi Arabia Electronic Medical Records Market, Segmentation By Product, Historic And Forecast, 2019 – 2024, 2029F, 2034F, $ Million
    • Table 183: Saudi Arabia Electronic Medical Records Market, Segmentation By Mode Of Delivery, Historic And Forecast, 2019 – 2024, 2029F, 2034F, $ Million
    • Table 184: Israel Electronic Medical Records Market, Segmentation By Type, Historic And Forecast, 2019 – 2024, 2029F, 2034F, $ Million
    • Table 185: Israel Electronic Medical Records Market, Segmentation By Product, Historic And Forecast, 2019 – 2024, 2029F, 2034F, $ Million
    • Table 186: Israel Electronic Medical Records Market, Segmentation By Mode Of Delivery, Historic And Forecast, 2019 – 2024, 2029F, 2034F, $ Million
    • Table 187: Iran Electronic Medical Records Market, Segmentation By Type, Historic And Forecast, 2019 – 2024, 2029F, 2034F, $ Million
    • Table 188: Iran Electronic Medical Records Market, Segmentation By Product, Historic And Forecast, 2019 – 2024, 2029F, 2034F, $ Million
    • Table 189: Iran Electronic Medical Records Market, Segmentation By Mode Of Delivery, Historic And Forecast, 2019 – 2024, 2029F, 2034F, $ Million
    • Table 190: Turkey Electronic Medical Records Market, Segmentation By Type, Historic And Forecast, 2019 – 2024, 2029F, 2034F, $ Million
    • Table 191: Turkey Electronic Medical Records Market, Segmentation By Product, Historic And Forecast, 2019 – 2024, 2029F, 2034F, $ Million
    • Table 192: Turkey Electronic Medical Records Market, Segmentation By Mode Of Delivery, Historic And Forecast, 2019 – 2024, 2029F, 2034F, $ Million
    • Table 193: United Arab Emirates Electronic Medical Records Market, Segmentation By Type, Historic And Forecast, 2019 – 2024, 2029F, 2034F, $ Million
    • Table 194: United Arab Emirates Electronic Medical Records Market, Segmentation By Product, Historic And Forecast, 2019 – 2024, 2029F, 2034F, $ Million
    • Table 195: United Arab Emirates Electronic Medical Records Market, Segmentation By Mode Of Delivery, Historic And Forecast, 2019 – 2024, 2029F, 2034F, $ Million
    • Table 196: Africa GDP Per Capita, By Country, 2019-2024, $
    • Table 197:  Africa Population, By Country, 2019-2029, Millions
    • Table 198: Africa Electronic Medical Records Market, Segmentation By Type, Historic And Forecast, 2019 – 2024, 2029F, 2034F, $ Million
    • Table 199: Africa Electronic Medical Records Market, Segmentation By Product, Historic And Forecast, 2019 – 2024, 2029F, 2034F, $ Million
    • Table 200: Africa Electronic Medical Records Market, Segmentation By Mode Of Delivery, Historic And Forecast, 2019 – 2024, 2029F, 2034F, $ Million
    • Table 201: Egypt Electronic Medical Records Market, Segmentation By Type, Historic And Forecast, 2019 – 2024, 2029F, 2034F, $ Million
    • Table 202: Egypt Electronic Medical Records Market, Segmentation By Product, Historic And Forecast, 2019 – 2024, 2029F, 2034F, $ Million
    • Table 203: Egypt Electronic Medical Records Market, Segmentation By Mode Of Delivery, Historic And Forecast, 2019 – 2024, 2029F, 2034F, $ Million
    • Table 204: Nigeria Electronic Medical Records Market, Segmentation By Type, Historic And Forecast, 2019 – 2024, 2029F, 2034F, $ Million
    • Table 205: Nigeria Electronic Medical Records Market, Segmentation By Product, Historic And Forecast, 2019 – 2024, 2029F, 2034F, $ Million
    • Table 206: Nigeria Electronic Medical Records Market, Segmentation By Mode Of Delivery, Historic And Forecast, 2019 – 2024, 2029F, 2034F, $ Million
    • Table 207: South Africa Electronic Medical Records Market, Segmentation By Type, Historic And Forecast, 2019 – 2024, 2029F, 2034F, $ Million
    • Table 208: South Africa Electronic Medical Records Market, Segmentation By Product, Historic And Forecast, 2019 – 2024, 2029F, 2034F, $ Million
    • Table 209: South Africa Electronic Medical Records Market, Segmentation By Mode Of Delivery, Historic And Forecast, 2019 – 2024, 2029F, 2034F, $ Million
    • Table 210: Global Electronic Medical Records Market, Key Competitor Estimated Market Shares, 2023, Percentage (%)
    • Table 211: Epic Systems Corporation – Financial Overview, 2023, $ Billion
    • Table 212: Oracle (Cerner Corporation) – Financial Overview, 2019 – 2023, $ Billion
    • Table 213: MEDITECH (Medical Information Technology Inc) – Financial Overview, 2023, $ Billion
    • Table 214: CompuGroup Medical SE & Co. KGaA. - Financial Overview, 2019 – 2023, $ Billion
    • Table 215: NextGen Healthcare LLC – Financial Overview, 2023, $Billion
    • Table 216: Electronic Medical Records Market, Competitive Benchmarking (In USD Billions)
    • Table 217: Electronic Medical Records Market, Competitive Dashboard
    • Table 218: Global Electronic Medical Records Market Size Gain ($ Million), 2024 – 2029, By Country
    • Table 219: Global Electronic Medical Records Market Size Gain ($ Million), Segmentation By Source, 2024 – 2029
    • Table 220: Global Electronic Medical Records Market Size Gain ($ Million), Segmentation By Product, 2024 – 2029
    • Table 221: Global Electronic Medical Records Market Size Gain ($ Million), Segmentation By Mode Of Delivery, 2024 – 2029
    • Table 222: Global Electronic Medical Records Market Size Gain ($ Million), Segmentation By Business Models, 2024 – 2029
    • Table 223: Global Electronic Medical Records Market Size Gain ($ Million), Segmentation By End-User, 2024 – 2029
    • Table 224: Electronic Medical Records Market Data Sources

    List Of Figures

      Figure 1: Global Electronic Medical Records Market Segmentation By Type
    • Figure 2: Global Electronic Medical Records Market Segmentation By Product
    • Figure 3: Global Electronic Medical Records Market Segmentation By Mode Of Delivery
    • Figure 4: Global Electronic Medical Records Market Segmentation By Business Models
    • Figure 5: Global Electronic Medical Records Market Segmentation By Applications
    • Figure 6: Global Electronic Medical Records Market, PESTEL (Political, Economic, Social, Technology, Environmental and Legal) Analysis
    • Figure 7: Global Electronic Medical Records Market, Historic, 2019 – 2024, $ Million
    • Figure 8: Global Electronic Medical Records Market, Forecast, 2024 – 2029, 2034F, $ Million
    • Figure 9: Global Electronic Medical Records Market, Segmentation By Type, Historic And Forecast, 2019 – 2024, 2029F, 2034F, $ Million
    • Figure 10: Global Electronic Medical Records Market, Segmentation By Product, Historic And Forecast, 2019 – 2024, 2029F, 2034F, $ Million
    • Figure 11: Global Electronic Medical Records Market, Segmentation By Mode Of Delivery, Historic And Forecast, 2019 – 2024, 2029F, 2034F, $ Million
    • Figure 12: Global Electronic Medical Records Market, Segmentation By Business Models, Historic And Forecast, 2019 – 2024, 2029F, 2034F, $ Million
    • Figure 13: Global Electronic Medical Records Market, Segmentation By Application, Historic And Forecast, 2019 – 2024, 2029F, 2034F, $ Million
    • Figure 14: Global Electronic Medical Records Market, Sub-Segmentation Of Acute, By Type, Historic And Forecast, 2019 – 2024, 2029F, 2034F, $ Million
    • Figure 15: Global Electronic Medical Records Market, Sub-Segmentation By Ambulatory, By Type, Historic And Forecast, 2019 – 2024, 2029F, 2034F, $ Million
    • Figure 16: Global Electronic Medical Records Market, Sub-Segmentation By Post-Acute, By Type, Historic And Forecast, 2019 – 2024, 2029F, 2034F, $ Million
    • Figure 17: Global Electronic Medical Records Market, By Region, Historic and Forecast, 2019 – 2024, 2029F, 2034F, $ Million
    • Figure 18: Global Electronic Medical Records Market, By Country, Historic and Forecast, 2019 – 2024, 2029F, 2034F, $ Million
    • Figure 19: Asia-Pacific Electronic Medical Records Market, Segmentation By Type, Historic And Forecast, 2019 – 2024, 2029F, 2034F, $ Million
    • Figure 20: Asia-Pacific Electronic Medical Records Market, Segmentation By Product, Historic And Forecast, 2019 – 2024, 2029F, 2034F, $ Million
    • Figure 21: Asia-Pacific Electronic Medical Records Market, Segmentation By Mode Of Delivery, Historic And Forecast, 2019 – 2024, 2029F, 2034F, $ Million
    • Figure 22: China Electronic Medical Records Market, Segmentation By Type, Historic And Forecast, 2019 – 2024, 2029F, 2034F, $ Million
    • Figure 23: China Electronic Medical Records Market, Segmentation By Product, Historic And Forecast, 2019 – 2024, 2029F, 2034F, $ Million
    • Figure 24: China Electronic Medical Records Market, Segmentation By Mode Of Delivery, Historic And Forecast, 2019 – 2024, 2029F, 2034F, $ Million
    • Figure 25: India Electronic Medical Records Market, Segmentation By Type, Historic And Forecast, 2019 – 2024, 2029F, 2034F, $ Million
    • Figure 26: India Electronic Medical Records Market, Segmentation By Product, Historic And Forecast, 2019 – 2024, 2029F, 2034F, $ Million
    • Figure 27: India Electronic Medical Records Market, Segmentation By Mode Of Delivery, Historic And Forecast, 2019 – 2024, 2029F, 2034F, $ Million
    • Figure 28: Japan Electronic Medical Records Market, Segmentation By Type, Historic And Forecast, 2019 – 2024, 2029F, 2034F, $ Million
    • Figure 29: Japan Electronic Medical Records Market, Segmentation By Product, Historic And Forecast, 2019 – 2024, 2029F, 2034F, $ Million
    • Figure 30: Japan Electronic Medical Records Market, Segmentation By Mode Of Delivery, Historic And Forecast, 2019 – 2024, 2029F, 2034F, $ Million
    • Figure 31: Australia Electronic Medical Records Market, Segmentation By Type, Historic And Forecast, 2019 – 2024, 2029F, 2034F, $ Million
    • Figure 32: Australia Electronic Medical Records Market, Segmentation By Product, Historic And Forecast, 2019 – 2024, 2029F, 2034F, $ Million
    • Figure 33: Australia Electronic Medical Records Market, Segmentation By Mode Of Delivery, Historic And Forecast, 2019 – 2024, 2029F, 2034F, $ Million
    • Figure 34: Indonesia Electronic Medical Records Market, Segmentation By Type, Historic And Forecast, 2019 – 2024, 2029F, 2034F, $ Million
    • Figure 35: Indonesia Electronic Medical Records Market, Segmentation By Product, Historic And Forecast, 2019 – 2024, 2029F, 2034F, $ Million
    • Figure 36: Indonesia Electronic Medical Records Market, Segmentation By Mode Of Delivery, Historic And Forecast, 2019 – 2024, 2029F, 2034F, $ Million
    • Figure 37: South Korea Electronic Medical Records Market, Segmentation By Type, Historic And Forecast, 2019 – 2024, 2029F, 2034F, $ Million
    • Figure 38: South Korea Electronic Medical Records Market, Segmentation By Product, Historic And Forecast, 2019 – 2024, 2029F, 2034F, $ Million
    • Figure 39: South Korea Electronic Medical Records Market, Segmentation By Mode Of Delivery, Historic And Forecast, 2019 – 2024, 2029F, 2034F, $ Million
    • Figure 40: Bangladesh Electronic Medical Records Market, Segmentation By Type, Historic And Forecast, 2019 – 2024, 2029F, 2034F, $ Million
    • Figure 41: Bangladesh Electronic Medical Records Market, Segmentation By Product, Historic And Forecast, 2019 – 2024, 2029F, 2034F, $ Million
    • Figure 42: Bangladesh Electronic Medical Records Market, Segmentation By Mode Of Delivery, Historic And Forecast, 2019 – 2024, 2029F, 2034F, $ Million
    • Figure 43: Thailand Electronic Medical Records Market, Segmentation By Type, Historic And Forecast, 2019 – 2024, 2029F, 2034F, $ Million
    • Figure 44: Thailand Electronic Medical Records Market, Segmentation By Product, Historic And Forecast, 2019 – 2024, 2029F, 2034F, $ Million
    • Figure 45: Thailand Electronic Medical Records Market, Segmentation By Mode Of Delivery, Historic And Forecast, 2019 – 2024, 2029F, 2034F, $ Million
    • Figure 46: Vietnam Electronic Medical Records Market, Segmentation By Type, Historic And Forecast, 2019 – 2024, 2029F, 2034F, $ Million
    • Figure 47: Vietnam Electronic Medical Records Market, Segmentation By Product, Historic And Forecast, 2019 – 2024, 2029F, 2034F, $ Million
    • Figure 48: Vietnam Electronic Medical Records Market, Segmentation By Mode Of Delivery, Historic And Forecast, 2019 – 2024, 2029F, 2034F, $ Million
    • Figure 49: Malaysia Electronic Medical Records Market, Segmentation By Type, Historic And Forecast, 2019 – 2024, 2029F, 2034F, $ Million
    • Figure 50: Malaysia Electronic Medical Records Market, Segmentation By Product, Historic And Forecast, 2019 – 2024, 2029F, 2034F, $ Million
    • Figure 51: Malaysia Electronic Medical Records Market, Segmentation By Mode Of Delivery, Historic And Forecast, 2019 – 2024, 2029F, 2034F, $ Million
    • Figure 52: Singapore Electronic Medical Records Market, Segmentation By Type, Historic And Forecast, 2019 – 2024, 2029F, 2034F, $ Million
    • Figure 53: Singapore Electronic Medical Records Market, Segmentation By Product, Historic And Forecast, 2019 – 2024, 2029F, 2034F, $ Million
    • Figure 54: Singapore Electronic Medical Records Market, Segmentation By Mode Of Delivery, Historic And Forecast, 2019 – 2024, 2029F, 2034F, $ Million
    • Figure 55: Philippines Electronic Medical Records Market, Segmentation By Type, Historic And Forecast, 2019 – 2024, 2029F, 2034F, $ Million
    • Figure 56: Philippines Electronic Medical Records Market, Segmentation By Product, Historic And Forecast, 2019 – 2024, 2029F, 2034F, $ Million
    • Figure 57: Philippines Electronic Medical Records Market, Segmentation By Mode Of Delivery, Historic And Forecast, 2019 – 2024, 2029F, 2034F, $ Million
    • Figure 58: Hong Kong Electronic Medical Records Market, Segmentation By Type, Historic And Forecast, 2019 – 2024, 2029F, 2034F, $ Million
    • Figure 59: Hong Kong Electronic Medical Records Market, Segmentation By Product, Historic And Forecast, 2019 – 2024, 2029F, 2034F, $ Million
    • Figure 60: Hong Kong Electronic Medical Records Market, Segmentation By Mode Of Delivery, Historic And Forecast, 2019 – 2024, 2029F, 2034F, $ Million
    • Figure 61: New Zealand Electronic Medical Records Market, Segmentation By Type, Historic And Forecast, 2019 – 2024, 2029F, 2034F, $ Million
    • Figure 62: New Zealand Electronic Medical Records Market, Segmentation By Product, Historic And Forecast, 2019 – 2024, 2029F, 2034F, $ Million
    • Figure 63: New Zealand Electronic Medical Records Market, Segmentation By Mode Of Delivery, Historic And Forecast, 2019 – 2024, 2029F, 2034F, $ Million
    • Figure 64: Western Europe Electronic Medical Records Market, Segmentation By Type, Historic And Forecast, 2019 – 2024, 2029F, 2034F, $ Million
    • Figure 65: Western Europe Electronic Medical Records Market, Segmentation By Product, Historic And Forecast, 2019 – 2024, 2029F, 2034F, $ Million
    • Figure 66: Western Europe Electronic Medical Records Market, Segmentation By Mode Of Delivery, Historic And Forecast, 2019 – 2024, 2029F, 2034F, $ Million
    • Figure 67: UK Electronic Medical Records Market, Segmentation By Type, Historic And Forecast, 2019 – 2024, 2029F, 2034F, $ Million
    • Figure 68: UK Electronic Medical Records Market, Segmentation By Product, Historic And Forecast, 2019 – 2024, 2029F, 2034F, $ Million
    • Figure 69: UK Electronic Medical Records Market, Segmentation By Mode Of Delivery, Historic And Forecast, 2019 – 2024, 2029F, 2034F, $ Million
    • Figure 70: Germany Electronic Medical Records Market, Segmentation By Type, Historic And Forecast, 2019 – 2024, 2029F, 2034F, $ Million
    • Figure 71: Germany Electronic Medical Records Market, Segmentation By Product, Historic And Forecast, 2019 – 2024, 2029F, 2034F, $ Million
    • Figure 72: Germany Electronic Medical Records Market, Segmentation By Mode Of Delivery, Historic And Forecast, 2019 – 2024, 2029F, 2034F, $ Million
    • Figure 73: France Electronic Medical Records Market, Segmentation By Type, Historic And Forecast, 2019 – 2024, 2029F, 2034F, $ Million
    • Figure 74: France Electronic Medical Records Market, Segmentation By Product, Historic And Forecast, 2019 – 2024, 2029F, 2034F, $ Million
    • Figure 75: France Electronic Medical Records Market, Segmentation By Mode Of Delivery, Historic And Forecast, 2019 – 2024, 2029F, 2034F, $ Million
    • Figure 76: Italy Electronic Medical Records Market, Segmentation By Type, Historic And Forecast, 2019 – 2024, 2029F, 2034F, $ Million
    • Figure 77: Italy Electronic Medical Records Market, Segmentation By Product, Historic And Forecast, 2019 – 2024, 2029F, 2034F, $ Million
    • Figure 78: Italy Electronic Medical Records Market, Segmentation By Mode Of Delivery, Historic And Forecast, 2019 – 2024, 2029F, 2034F, $ Million
    • Figure 79: Spain Electronic Medical Records Market, Segmentation By Type, Historic And Forecast, 2019 – 2024, 2029F, 2034F, $ Million
    • Figure 80: Spain Electronic Medical Records Market, Segmentation By Product, Historic And Forecast, 2019 – 2024, 2029F, 2034F, $ Million
    • Figure 81: Spain Electronic Medical Records Market, Segmentation By Mode Of Delivery, Historic And Forecast, 2019 – 2024, 2029F, 2034F, $ Million
    • Figure 82: Austria Electronic Medical Records Market, Segmentation By Type, Historic And Forecast, 2019 – 2024, 2029F, 2034F, $ Million
    • Figure 83: Austria Electronic Medical Records Market, Segmentation By Product, Historic And Forecast, 2019 – 2024, 2029F, 2034F, $ Million
    • Figure 84: Austria Electronic Medical Records Market, Segmentation By Mode Of Delivery, Historic And Forecast, 2019 – 2024, 2029F, 2034F, $ Million
    • Figure 85: Belgium Electronic Medical Records Market, Segmentation By Type, Historic And Forecast, 2019 – 2024, 2029F, 2034F, $ Million
    • Figure 86: Belgium Electronic Medical Records Market, Segmentation By Product, Historic And Forecast, 2019 – 2024, 2029F, 2034F, $ Million
    • Figure 87: Belgium Electronic Medical Records Market, Segmentation By Mode Of Delivery, Historic And Forecast, 2019 – 2024, 2029F, 2034F, $ Million
    • Figure 88: Denmark Electronic Medical Records Market, Segmentation By Type, Historic And Forecast, 2019 – 2024, 2029F, 2034F, $ Million
    • Figure 89: Denmark Electronic Medical Records Market, Segmentation By Product, Historic And Forecast, 2019 – 2024, 2029F, 2034F, $ Million
    • Figure 90: Denmark Electronic Medical Records Market, Segmentation By Mode Of Delivery, Historic And Forecast, 2019 – 2024, 2029F, 2034F, $ Million
    • Figure 91: Finland Electronic Medical Records Market, Segmentation By Type, Historic And Forecast, 2019 – 2024, 2029F, 2034F, $ Million
    • Figure 92: Finland Electronic Medical Records Market, Segmentation By Product, Historic And Forecast, 2019 – 2024, 2029F, 2034F, $ Million
    • Figure 93: Finland Electronic Medical Records Market, Segmentation By Mode Of Delivery, Historic And Forecast, 2019 – 2024, 2029F, 2034F, $ Million
    • Figure 94: Ireland Electronic Medical Records Market, Segmentation By Type, Historic And Forecast, 2019 – 2024, 2029F, 2034F, $ Million
    • Figure 95: Ireland Electronic Medical Records Market, Segmentation By Product, Historic And Forecast, 2019 – 2024, 2029F, 2034F, $ Million
    • Figure 96: Ireland Electronic Medical Records Market, Segmentation By Mode Of Delivery, Historic And Forecast, 2019 – 2024, 2029F, 2034F, $ Million
    • Figure 97: Netherlands Electronic Medical Records Market, Segmentation By Type, Historic And Forecast, 2019 – 2024, 2029F, 2034F, $ Million
    • Figure 98: Netherlands Electronic Medical Records Market, Segmentation By Product, Historic And Forecast, 2019 – 2024, 2029F, 2034F, $ Million
    • Figure 99: Netherlands Electronic Medical Records Market, Segmentation By Mode Of Delivery, Historic And Forecast, 2019 – 2024, 2029F, 2034F, $ Million
    • Figure 100: Norway Electronic Medical Records Market, Segmentation By Type, Historic And Forecast, 2019 – 2024, 2029F, 2034F, $ Million
    • Figure 101: Norway Electronic Medical Records Market, Segmentation By Product, Historic And Forecast, 2019 – 2024, 2029F, 2034F, $ Million
    • Figure 102: Norway Electronic Medical Records Market, Segmentation By Mode Of Delivery, Historic And Forecast, 2019 – 2024, 2029F, 2034F, $ Million
    • Figure 103: Portugal Electronic Medical Records Market, Segmentation By Type, Historic And Forecast, 2019 – 2024, 2029F, 2034F, $ Million
    • Figure 104: Portugal Electronic Medical Records Market, Segmentation By Product, Historic And Forecast, 2019 – 2024, 2029F, 2034F, $ Million
    • Figure 105: Portugal Electronic Medical Records Market, Segmentation By Mode Of Delivery, Historic And Forecast, 2019 – 2024, 2029F, 2034F, $ Million
    • Figure 106: Sweden Electronic Medical Records Market, Segmentation By Type, Historic And Forecast, 2019 – 2024, 2029F, 2034F, $ Million
    • Figure 107: Sweden Electronic Medical Records Market, Segmentation By Product, Historic And Forecast, 2019 – 2024, 2029F, 2034F, $ Million
    • Figure 108: Sweden Electronic Medical Records Market, Segmentation By Mode Of Delivery, Historic And Forecast, 2019 – 2024, 2029F, 2034F, $ Million
    • Figure 109: Switzerland Electronic Medical Records Market, Segmentation By Type, Historic And Forecast, 2019 – 2024, 2029F, 2034F, $ Million
    • Figure 110: Switzerland Electronic Medical Records Market, Segmentation By Product, Historic And Forecast, 2019 – 2024, 2029F, 2034F, $ Million
    • Figure 111: Switzerland Electronic Medical Records Market, Segmentation By Mode Of Delivery, Historic And Forecast, 2019 – 2024, 2029F, 2034F, $ Million
    • Figure 112: Eastern Europe Electronic Medical Records Market, Segmentation By Type, Historic And Forecast, 2019 – 2024, 2029F, 2034F, $ Million
    • Figure 113: Eastern Europe Electronic Medical Records Market, Segmentation By Product, Historic And Forecast, 2019 – 2024, 2029F, 2034F, $ Million
    • Figure 114: Eastern Europe Electronic Medical Records Market, Segmentation By Mode Of Delivery, Historic And Forecast, 2019 – 2024, 2029F, 2034F, $ Million
    • Figure 115: Russia Electronic Medical Records Market, Segmentation By Type, Historic And Forecast, 2019 – 2024, 2029F, 2034F, $ Million
    • Figure 116: Russia Electronic Medical Records Market, Segmentation By Product, Historic And Forecast, 2019 – 2024, 2029F, 2034F, $ Million
    • Figure 117: Russia Electronic Medical Records Market, Segmentation By Mode Of Delivery, Historic And Forecast, 2019 – 2024, 2029F, 2034F, $ Million
    • Figure 118: Czech Republic Electronic Medical Records Market, Segmentation By Type, Historic And Forecast, 2019 – 2024, 2029F, 2034F, $ Million
    • Figure 119: Czech Republic Electronic Medical Records Market, Segmentation By Product, Historic And Forecast, 2019 – 2024, 2029F, 2034F, $ Million
    • Figure 120: Czech Republic Electronic Medical Records Market, Segmentation By Mode Of Delivery, Historic And Forecast, 2019 – 2024, 2029F, 2034F, $ Million
    • Figure 121: Poland Electronic Medical Records Market, Segmentation By Type, Historic And Forecast, 2019 – 2024, 2029F, 2034F, $ Million
    • Figure 122: Poland Electronic Medical Records Market, Segmentation By Product, Historic And Forecast, 2019 – 2024, 2029F, 2034F, $ Million
    • Figure 123: Poland Electronic Medical Records Market, Segmentation By Mode Of Delivery, Historic And Forecast, 2019 – 2024, 2029F, 2034F, $ Million
    • Figure 124: Romania Electronic Medical Records Market, Segmentation By Type, Historic And Forecast, 2019 – 2024, 2029F, 2034F, $ Million
    • Figure 125: Romania Electronic Medical Records Market, Segmentation By Product, Historic And Forecast, 2019 – 2024, 2029F, 2034F, $ Million
    • Figure 126: Romania Electronic Medical Records Market, Segmentation By Mode Of Delivery, Historic And Forecast, 2019 – 2024, 2029F, 2034F, $ Million
    • Figure 127: Ukraine Electronic Medical Records Market, Segmentation By Type, Historic And Forecast, 2019 – 2024, 2029F, 2034F, $ Million
    • Figure 128: Ukraine Electronic Medical Records Market, Segmentation By Product, Historic And Forecast, 2019 – 2024, 2029F, 2034F, $ Million
    • Figure 129: Ukraine Electronic Medical Records Market, Segmentation By Mode Of Delivery, Historic And Forecast, 2019 – 2024, 2029F, 2034F, $ Million
    • Figure 130: North America Electronic Medical Records Market, Segmentation By Type, Historic And Forecast, 2019 – 2024, 2029F, 2034F, $ Million
    • Figure 131: North America Electronic Medical Records Market, Segmentation By Product, Historic And Forecast, 2019 – 2024, 2029F, 2034F, $ Million
    • Figure 132: North America Electronic Medical Records Market, Segmentation By Mode Of Delivery, Historic And Forecast, 2019 – 2024, 2029F, 2034F, $ Million
    • Figure 133: USA Electronic Medical Records Market, Segmentation By Type, Historic And Forecast, 2019 – 2024, 2029F, 2034F, $ Million
    • Figure 134: USA Electronic Medical Records Market, Segmentation By Product, Historic And Forecast, 2019 – 2024, 2029F, 2034F, $ Million
    • Figure 135: USA Electronic Medical Records Market, Segmentation By Mode Of Delivery, Historic And Forecast, 2019 – 2024, 2029F, 2034F, $ Million
    • Figure 136: Canada Electronic Medical Records Market, Segmentation By Type, Historic And Forecast, 2019 – 2024, 2029F, 2034F, $ Million
    • Figure 137: Canada Electronic Medical Records Market, Segmentation By Product, Historic And Forecast, 2019 – 2024, 2029F, 2034F, $ Million
    • Figure 138: Canada Electronic Medical Records Market, Segmentation By Mode Of Delivery, Historic And Forecast, 2019 – 2024, 2029F, 2034F, $ Million
    • Figure 139: Mexico Electronic Medical Records Market, Segmentation By Type, Historic And Forecast, 2019 – 2024, 2029F, 2034F, $ Million
    • Figure 140: Mexico Electronic Medical Records Market, Segmentation By Product, Historic And Forecast, 2019 – 2024, 2029F, 2034F, $ Million
    • Figure 141: Mexico Electronic Medical Records Market, Segmentation By Mode Of Delivery, Historic And Forecast, 2019 – 2024, 2029F, 2034F, $ Million
    • Figure 142: South America Electronic Medical Records Market, Segmentation By Type, Historic And Forecast, 2019 – 2024, 2029F, 2034F, $ Million
    • Figure 143: South America Electronic Medical Records Market, Segmentation By Product, Historic And Forecast, 2019 – 2024, 2029F, 2034F, $ Million
    • Figure 144: South America Electronic Medical Records Market, Segmentation By Mode Of Delivery, Historic And Forecast, 2019 – 2024, 2029F, 2034F, $ Million
    • Figure 145: Brazil Electronic Medical Records Market, Segmentation By Type, Historic And Forecast, 2019 – 2024, 2029F, 2034F, $ Million
    • Figure 146: Brazil Electronic Medical Records Market, Segmentation By Product, Historic And Forecast, 2019 – 2024, 2029F, 2034F, $ Million
    • Figure 147: Brazil Electronic Medical Records Market, Segmentation By Mode Of Delivery, Historic And Forecast, 2019 – 2024, 2029F, 2034F, $ Million
    • Figure 148: Chile Electronic Medical Records Market, Segmentation By Type, Historic And Forecast, 2019 – 2024, 2029F, 2034F, $ Million
    • Figure 149: Chile Electronic Medical Records Market, Segmentation By Product, Historic And Forecast, 2019 – 2024, 2029F, 2034F, $ Million
    • Figure 150: Chile Electronic Medical Records Market, Segmentation By Mode Of Delivery, Historic And Forecast, 2019 – 2024, 2029F, 2034F, $ Million
    • Figure 151: Argentina Electronic Medical Records Market, Segmentation By Type, Historic And Forecast, 2019 – 2024, 2029F, 2034F, $ Million
    • Figure 152: Argentina Electronic Medical Records Market, Segmentation By Product, Historic And Forecast, 2019 – 2024, 2029F, 2034F, $ Million
    • Figure 153: Argentina Electronic Medical Records Market, Segmentation By Mode Of Delivery, Historic And Forecast, 2019 – 2024, 2029F, 2034F, $ Million
    • Figure 154: Colombia Electronic Medical Records Market, Segmentation By Type, Historic And Forecast, 2019 – 2024, 2029F, 2034F, $ Million
    • Figure 155: Colombia Electronic Medical Records Market, Segmentation By Product, Historic And Forecast, 2019 – 2024, 2029F, 2034F, $ Million
    • Figure 156: Colombia Electronic Medical Records Market, Segmentation By Mode Of Delivery, Historic And Forecast, 2019 – 2024, 2029F, 2034F, $ Million
    • Figure 157: Peru Electronic Medical Records Market, Segmentation By Type, Historic And Forecast, 2019 – 2024, 2029F, 2034F, $ Million
    • Figure 158: Peru Electronic Medical Records Market, Segmentation By Product, Historic And Forecast, 2019 – 2024, 2029F, 2034F, $ Million
    • Figure 159: Peru Electronic Medical Records Market, Segmentation By Mode Of Delivery, Historic And Forecast, 2019 – 2024, 2029F, 2034F, $ Million
    • Figure 160: Middle East Electronic Medical Records Market, Segmentation By Type, Historic And Forecast, 2019 – 2024, 2029F, 2034F, $ Million
    • Figure 161: Middle East Electronic Medical Records Market, Segmentation By Product, Historic And Forecast, 2019 – 2024, 2029F, 2034F, $ Million
    • Figure 162: Middle East Electronic Medical Records Market, Segmentation By Mode Of Delivery, Historic And Forecast, 2019 – 2024, 2029F, 2034F, $ Million
    • Figure 163: Saudi Arabia Electronic Medical Records Market, Segmentation By Type, Historic And Forecast, 2019 – 2024, 2029F, 2034F, $ Million
    • Figure 164: Saudi Arabia Electronic Medical Records Market, Segmentation By Product, Historic And Forecast, 2019 – 2024, 2029F, 2034F, $ Million
    • Figure 165: Saudi Arabia Electronic Medical Records Market, Segmentation By Mode Of Delivery, Historic And Forecast, 2019 – 2024, 2029F, 2034F, $ Million
    • Figure 166: Israel Electronic Medical Records Market, Segmentation By Type, Historic And Forecast, 2019 – 2024, 2029F, 2034F, $ Million
    • Figure 167: Israel Electronic Medical Records Market, Segmentation By Product, Historic And Forecast, 2019 – 2024, 2029F, 2034F, $ Million
    • Figure 168: Israel Electronic Medical Records Market, Segmentation By Mode Of Delivery, Historic And Forecast, 2019 – 2024, 2029F, 2034F, $ Million
    • Figure 169: Iran Electronic Medical Records Market, Segmentation By Type, Historic And Forecast, 2019 – 2024, 2029F, 2034F, $ Million
    • Figure 170: Iran Electronic Medical Records Market, Segmentation By Product, Historic And Forecast, 2019 – 2024, 2029F, 2034F, $ Million
    • Figure 171: Iran Electronic Medical Records Market, Segmentation By Mode Of Delivery, Historic And Forecast, 2019 – 2024, 2029F, 2034F, $ Million
    • Figure 172: Turkey Electronic Medical Records Market, Segmentation By Type, Historic And Forecast, 2019 – 2024, 2029F, 2034F, $ Million
    • Figure 173: Turkey Electronic Medical Records Market, Segmentation By Product, Historic And Forecast, 2019 – 2024, 2029F, 2034F, $ Million
    • Figure 174: Turkey Electronic Medical Records Market, Segmentation By Mode Of Delivery, Historic And Forecast, 2019 – 2024, 2029F, 2034F, $ Million
    • Figure 175: United Arab Emirates Electronic Medical Records Market, Segmentation By Type, Historic And Forecast, 2019 – 2024, 2029F, 2034F, $ Million
    • Figure 176: United Arab Emirates Electronic Medical Records Market, Segmentation By Product, Historic And Forecast, 2019 – 2024, 2029F, 2034F, $ Million
    • Figure 177: United Arab Emirates Electronic Medical Records Market, Segmentation By Mode Of Delivery, Historic And Forecast, 2019 – 2024, 2029F, 2034F, $ Million
    • Figure 178: Africa Electronic Medical Records Market, Segmentation By Type, Historic And Forecast, 2019 – 2024, 2029F, 2034F, $ Million
    • Figure 179: Africa Electronic Medical Records Market, Segmentation By Product, Historic And Forecast, 2019 – 2024, 2029F, 2034F, $ Million
    • Figure 180: Africa Electronic Medical Records Market, Segmentation By Mode Of Delivery, Historic And Forecast, 2019 – 2024, 2029F, 2034F, $ Million
    • Figure 181: Egypt Electronic Medical Records Market, Segmentation By Type, Historic And Forecast, 2019 – 2024, 2029F, 2034F, $ Million
    • Figure 182: Egypt Electronic Medical Records Market, Segmentation By Product, Historic And Forecast, 2019 – 2024, 2029F, 2034F, $ Million
    • Figure 183: Egypt Electronic Medical Records Market, Segmentation By Mode Of Delivery, Historic And Forecast, 2019 – 2024, 2029F, 2034F, $ Million
    • Figure 184: Nigeria Electronic Medical Records Market, Segmentation By Type, Historic And Forecast, 2019 – 2024, 2029F, 2034F, $ Million
    • Figure 185: Nigeria Electronic Medical Records Market, Segmentation By Product, Historic And Forecast, 2019 – 2024, 2029F, 2034F, $ Million
    • Figure 186: Nigeria Electronic Medical Records Market, Segmentation By Mode Of Delivery, Historic And Forecast, 2019 – 2024, 2029F, 2034F, $ Million
    • Figure 187: South Africa Electronic Medical Records Market, Segmentation By Type, Historic And Forecast, 2019 – 2024, 2029F, 2034F, $ Million
    • Figure 188: South Africa Electronic Medical Records Market, Segmentation By Product, Historic And Forecast, 2019 – 2024, 2029F, 2034F, $ Million
    • Figure 189: South Africa Electronic Medical Records Market, Segmentation By Mode Of Delivery, Historic And Forecast, 2019 – 2024, 2029F, 2034F, $ Million
    • Figure 190: Global Electronic Medical Records, Key Competitor Estimated Market Shares, 2023, Percentage (%)
    • Figure 191: Oracle (Cerner Corporation) – Financial Overview, 2019 – 2023, $ Billion
    • Figure 192: CompuGroup Medical SE & Co. KGaA. – Financial Overview, 2019 – 2023, $ Billion
    • Figure 193: Geographic Regions Covered
    View Report
    View Report
    View Report
    View Report
    View Report
    View Report
    Back to top
    Back to top